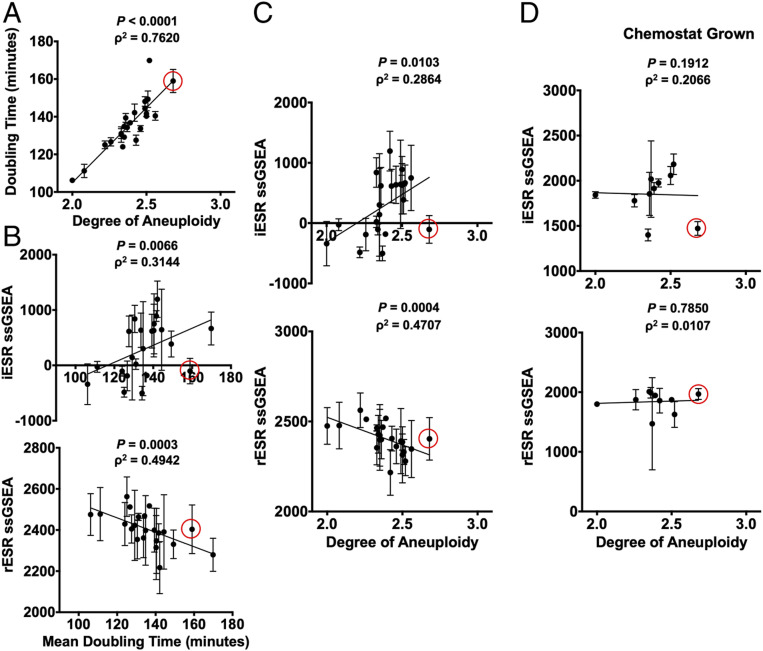
Fig. 3.
Complex aneuploid yeast strains exhibit the ESR. (A–C) Aneuploid yeast strains harboring aneuploidies ranging from 2N to 3N were grown to log phase in YEPD. For each strain, degree of aneuploidy was calculated as the fraction of base pairs in the aneuploid strain/base pairs in a haploid control strain. Doubling times were calculated from growth curves generated by measuring OD(600 nm) in 20-min intervals over 5 h in a plate reader. (A) Correlation between doubling time and degree of aneuploidy (Spearman, ρ2 = 0.7620, P < 0.0001). Transcriptomes of the complex aneuploid strains were analyzed by RNA-Seq, and ssGSEA projection values were calculated for iESR and rESR genes. Correlations between iESR ssGSEA projections and mean doubling time (Spearman, ρ2 = 0.3144, P = 0.0066) and rESR ssGSEA projections and mean doubling time (Spearman, ρ2 = 0.4942, P = 0.0003) are shown in B. Correlations between iESR ssGSEA projections and degree of aneuploidy (Spearman, ρ2 = 0.2864, P = 0.0103) and rESR ssGSEA projections and degree of aneuploidy (Spearman, ρ2 = 0.4707, P = 0.0004) are shown in C. Error bars represent SD from the mean. (D) Select complex aneuploid strains were grown in a phosphate-limiting chemostat until steady state was reached. Transcriptomes of harvested cells were analyzed by RNA-Seq. ssGSEA projection values were calculated for iESR and rESR genes. Correlations between iESR ssGSEA projections and degree of aneuploidy (Spearman, ρ2 = 0.1912, P = 0.2066) and rESR ssGSEA projections and degree of aneuploidy (Spearman, ρ2 = 0.0107, P = 0.7850) are shown. Error bars represent SD from the mean of experimental replicates. The data point circled in red represents a complex aneuploid strain that does not mount the ESR.

