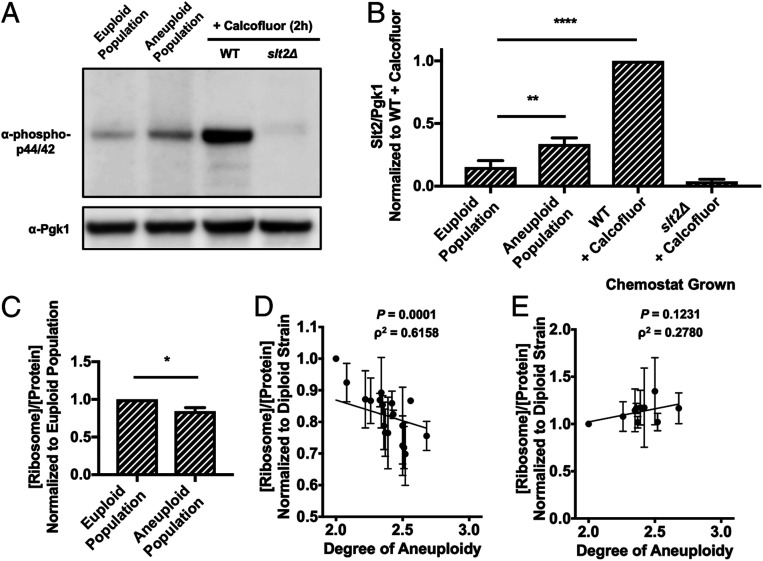
Fig. 4.
ESR induction causes ribosome loss in aneuploid strains. (A and B) Euploid and aneuploid cell populations were grown in YEPD with the 1:20 dilution protocol, and Slt2 Thr202/Tyr204 phosphorylation was determined. Wild-type euploid (A2050) and slt2Δ cells (A41265) treated with 5 μg/mL Calcofluor White for 2 h served as positive and negative controls, respectively, in immunoblots (A). Pgk1 served as a loading control. Quantifications of Slt2 Thr202/Tyr204 phosphorylation are shown in B. Slt2/Pgk1 values were normalized to the wild-type cells treated with Calcofluor White. Error bars represent SD from the mean of experimental replicates; one-way ANOVA test with multiple comparisons and Bonferroni correction, P < 0.0001 (****), P = 0.0021 (**). All other comparisons between samples had a significant difference of P < 0.0001 (****) with the exception of the euploid populations and slt2Δ + Calcofluor, which had a significant difference of P = 0.0288. (C) The fraction of ribosome in total protein extracts ([ribosome]/[protein]) was determined in euploid and aneuploid cell populations grown with the 1:20 dilution protocol. [ribosome]/[protein] in aneuploid cell populations was normalized to that in euploid cell populations. Error bars represent SD from the mean of technical replicates; unpaired two-tailed t test test, P = 0.0332 (*). (D) Aneuploid yeast strains harboring aneuploidies ranging from 2N to 3N were grown to log phase in YEPD and the fraction of ribosomes in total protein extracts ([ribosome]/[protein]) was determined. Correlation between [ribosome]/[protein] and degree of aneuploidy (ρ2 = 0.6158, P = 0.0001, Spearman) is shown. The calculated values were normalized to the [ribosome]/[protein] of a diploid control. (E) Aneuploid yeast strains harboring aneuploidies ranging from 2N to 3N were grown in a phosphate-limited chemostat and the fraction of ribosome in total protein extracts ([ribosome]/[protein]) was determined. Correlation between [ribosome]/[protein] and degree of aneuploidy (ρ2 = 0.2780, P = 0.1231, Spearman) is shown. The calculated values were normalized to the [ribosome]/[protein] of a diploid control. Error bars represent SD from the mean of experimental replicates.

