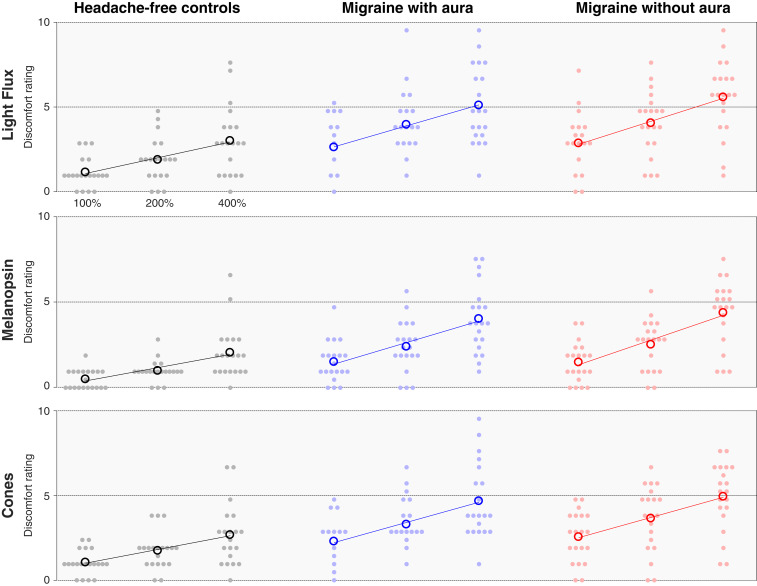
Fig. 2.
Discomfort ratings by stimulus and group. Each row presents the discomfort ratings elicited by stimuli that targeted a particular combination of photoreceptors, and each column contains the data from each individual group (n = 20 participants per group). The stimuli were presented at three different contrast levels (100, 200, and 400%), and these (log-spaced) values define the x axis of each subplot. The median (across trial) discomfort rating for a given stimulus and contrast is shown for each participant (filled circles), as is the mean rating across participants (open circles). The best-fit line to the mean discomfort rating across participants as a function of log contrast is shown in each subplot.

