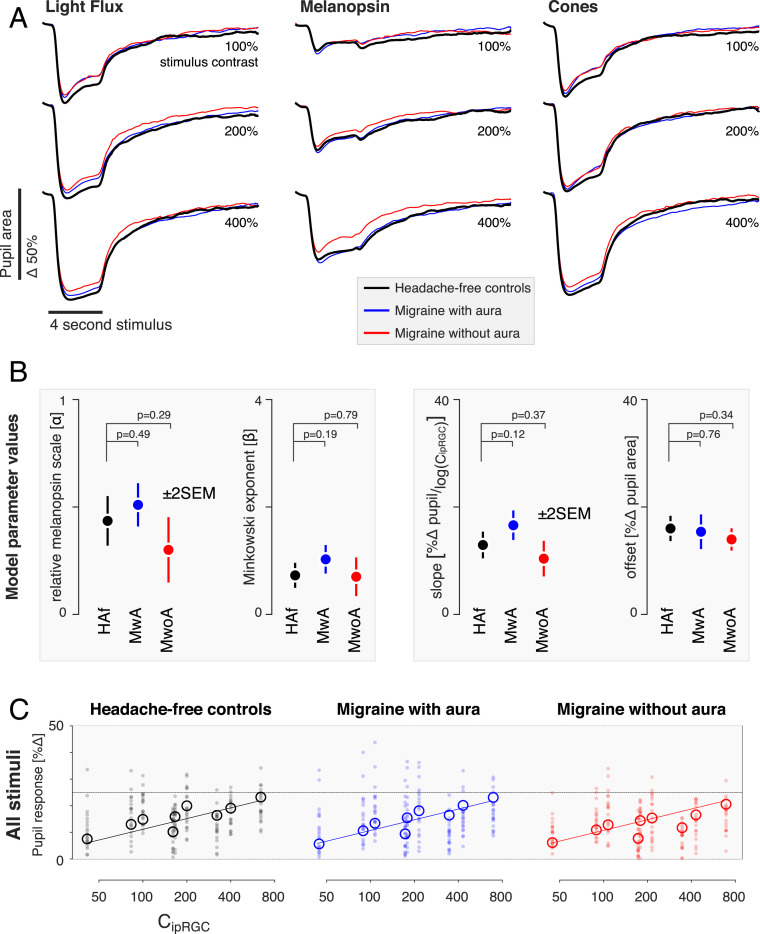
Fig. 4.
Pupil response by stimulus and group. (A) The average pupil response across participants within each group (n = 20 participants per group) is shown for each stimulus type (columns) at each contrast level (rows). The responses from the three groups for each stimulus type are superimposed. (B) We summarized the pupil responses by taking the mean of the percent change in amplitude of the pupil area across the recording period. These data were then fit with the two-stage model (Fig. 3). No significant differences between the groups in the parameter estimates were found (±2 SEM obtained via bootstrapping), although both the relative melanopsin scaling and Minkowski exponent values are smaller for pupil responses than was observed for discomfort ratings. (C) As no significant differences between groups were found for the parameters, we refit our model to the data forcing all parameters to be the same across groups. The plots report individual (filled circles) and mean (open circles) pupil response as a function of modeled ipRGC contrast.

