Fig. 1.
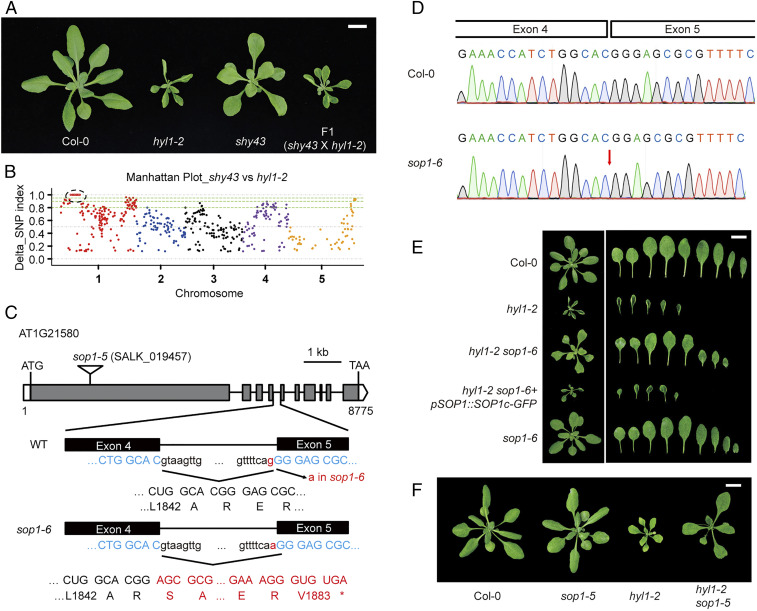
SOP1 mutations suppress the morphological defects of hyl1-2. (A) Vegetative phenotype of shy43, hyl1-2, and F1 plants from a cross between shy43 and hyl1-2. Aerial parts of 4-wk-old plants were photographed. (Scale bar, 1 cm.) (B) Manhattan plot showing the delta single nucleotide polymorphism (SNP) index between the shy43-like F2 pool and the hyl1-2 pool. SNP index was calculated by MutMAP (51). The causal gene was mapped to the left arm of Chr. 1, as highlighted by the black dotted circle. (C) Schematic structure of the SOP1 gene, the sop1-5 T-DNA insertion, and the sop1-6/sop1shy43 mutation. The sop1-6 mutation and the resultant amino acid changes are highlighted in red. Open box, 5′ or 3′ untranslated regions; gray box, exons; solid line, introns; *, stop codon. (D) Sanger sequencing of the SOP1 cDNA from the Col-0 and sop1-6 plants. In sop1-6, the G-to-A mutation at acceptor site of the fourth intron of SOP1 resulted in a 1-bp shift of the splicing acceptor site, and consequently led to one guanine deletion. (E) Phenotype of different mutants and transgenic plants. Four-week-old plants and their rosette leaves of the indicated genotypes are shown. (Scale bar, 1 cm.) (F) sop1-5 rescues the morphological defects of hyl1-2. Four-week-old plants are photographed. (Scale bar, 1 cm.)

