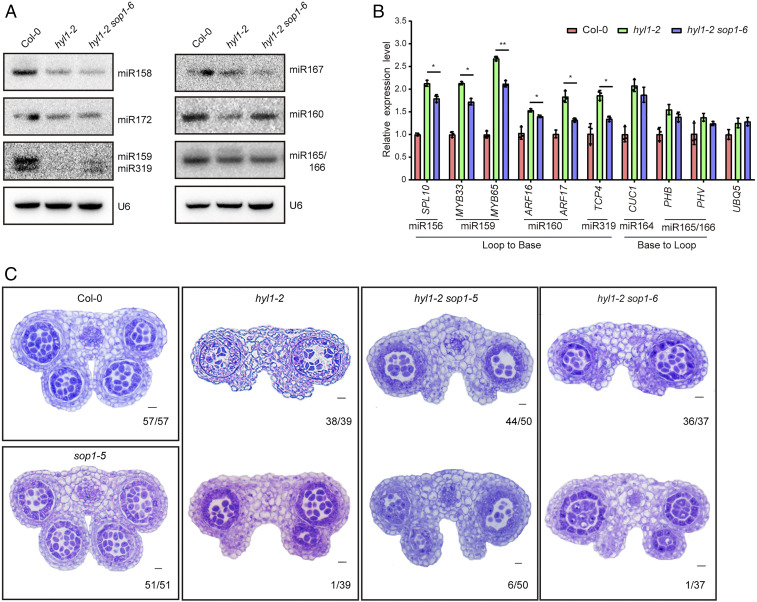
Fig. 2.
sop1-6 rescues a subset of miRNAs in hyl1-2. (A) Northern blot analysis of miRNA expression in Col-0, hyl1-2, and hyl1-2 sop1-6. U6 served as loading control. (B) qPCR analysis of the expression levels of miRNA target genes. ACTIN2 serves as an internal control. Another housekeeping gene UBQ5 was analyzed in parallel. Data are means of three biological replicates and error bars denote SD. Each dot point is the average value of three technical replicates. *P < 0.05; **P < 0.01 (paired t test). Inflorescence tissues of mixed stages were used in A and B. (C) Anther microsporangia phenotypes in Col-0 and different mutants. Numbers in the Lower Right corner of each panel indicate the number of anthers with shown phenotype vs. the total number of examined anthers.

