
Figure 1. Proteomic Analysis of MAP4K Protein Interaction Network.
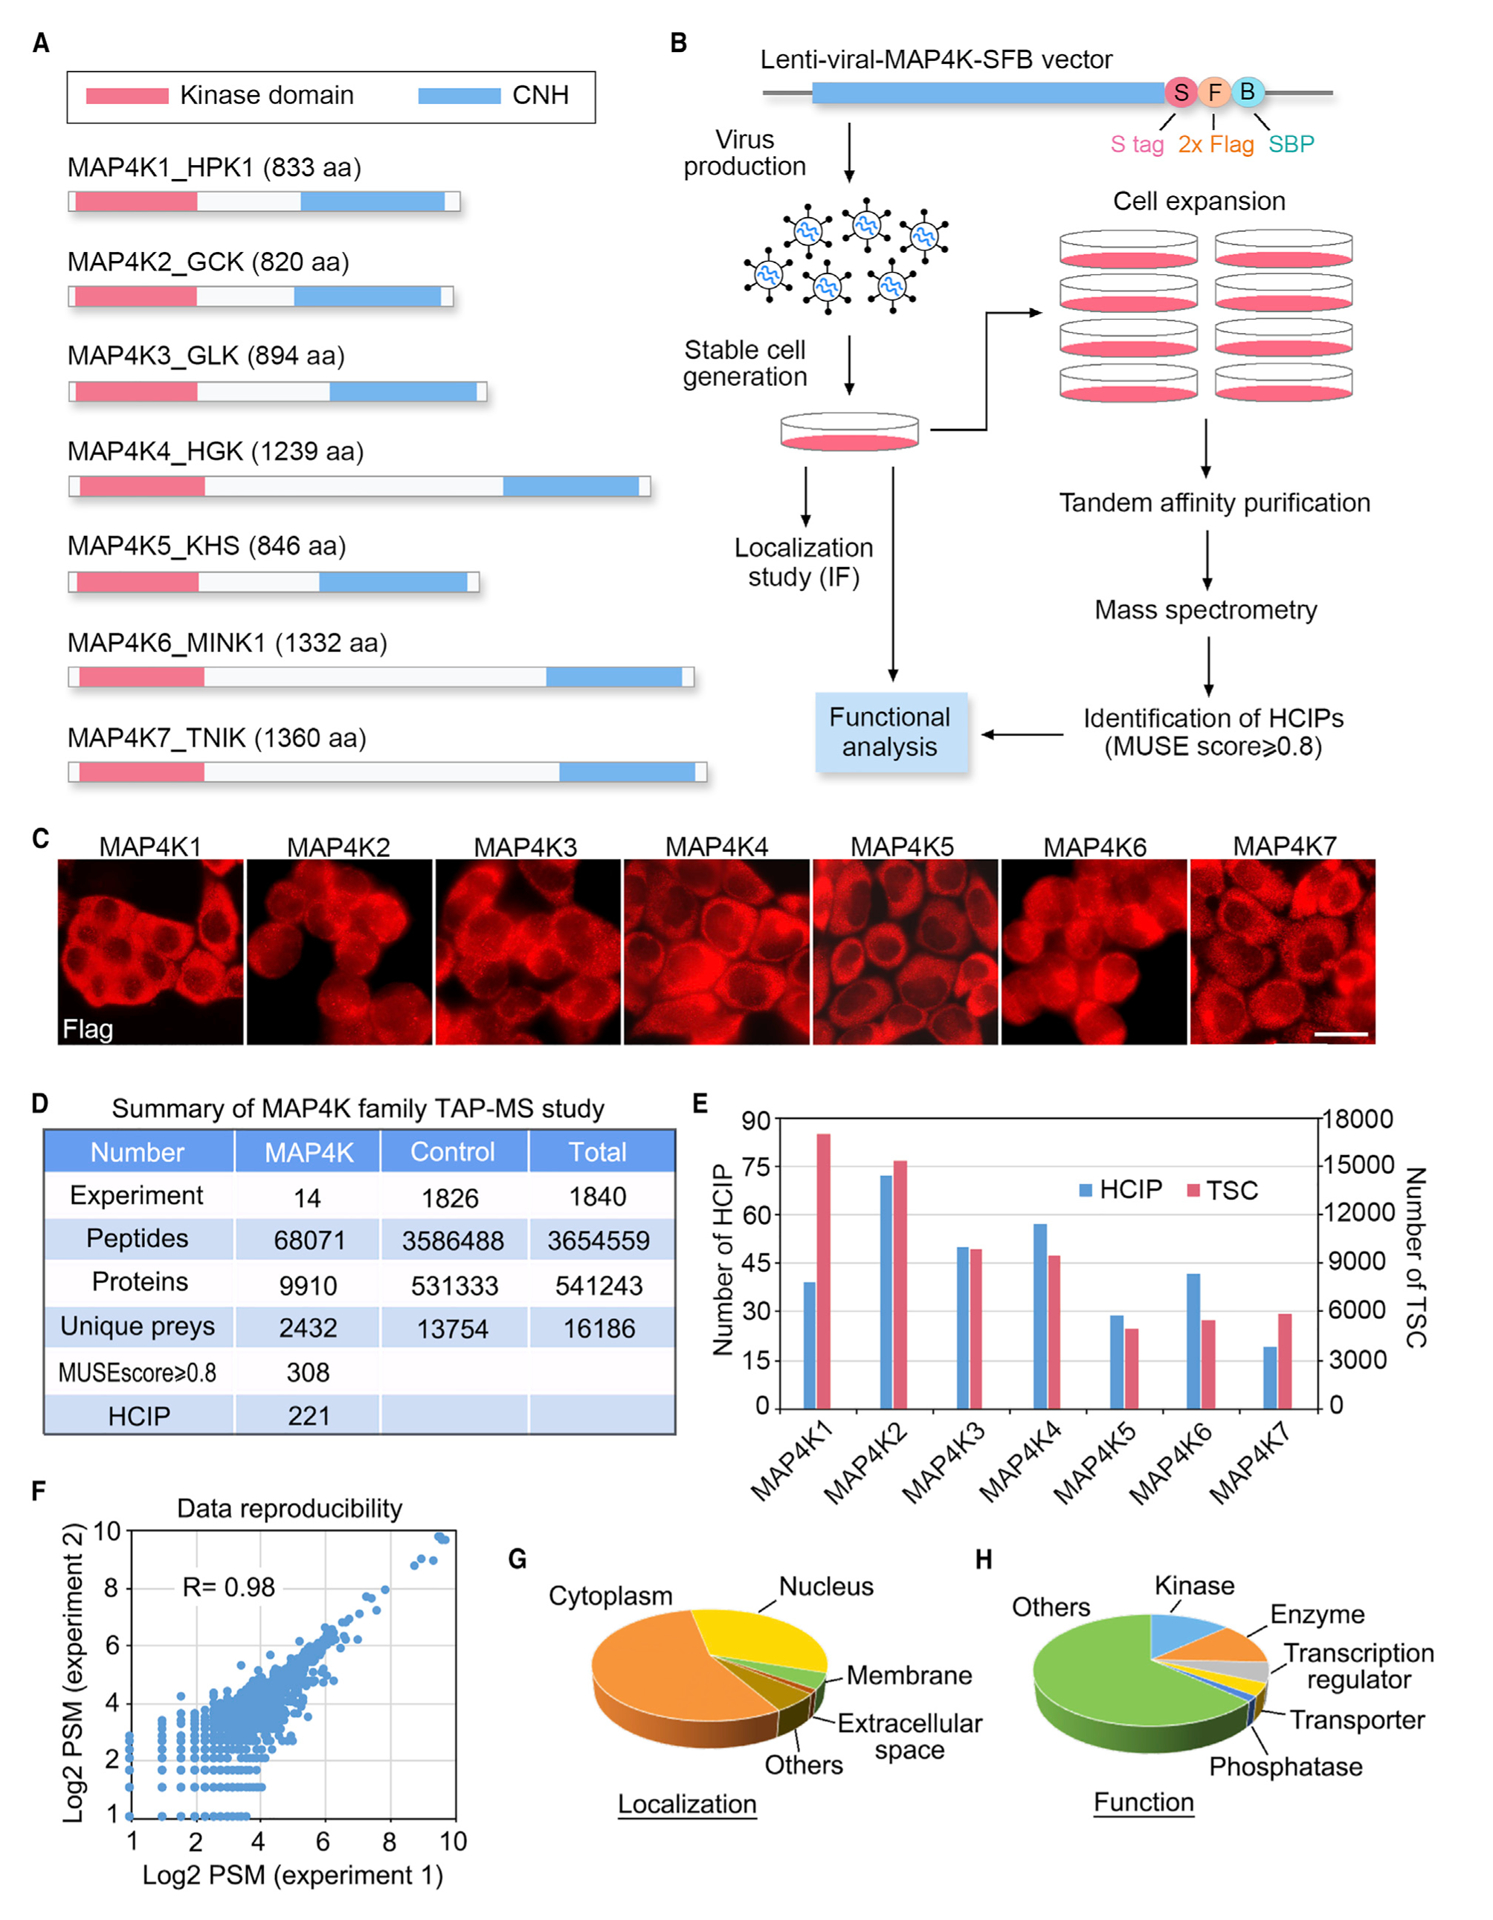
(A) Schematic illustration of the protein domains for the MAP4K family kinases.
(B) Schematic illustration of the major steps used in TAP-MS analysis of human MAP4K-associated protein complexes. MAP4Ks were constructed into a C-terminal SFB-tag-fused lentiviral vector. HEK293T cells stably expressing each bait protein were generated by lentiviral infection and puromycin selection. The purified protein complexes were identified by MS analysis, and final interacting proteins were generated using the MUSE statistical model.
(C) Localization of MAP4Ks in the HEK293A cells stably expressing each MAP4K family member. Immunofluorescent staining was performed by using FLAG antibody. Scale bar, 20 μm.
(D) Summary of the MAP4K TAP-MS analysis. Experiment information and total numbers of peptides and proteins identified in the MS analysis are shown. A MUSE score of ≥0.8 was used as the cutoff to identify HCIPs.
(E) The total spectral counts (TSCs) and corresponding numbers of HCIPs for MAP4Ks are shown.
(F) Data reproducibility between two biological TAP-MS experiments is evaluated using the number of peptide spectrum matches (PSMs).
(G and H) GO annotations of the identified MAP4Ks-HCIPs. Cellular localization (G) and cellular functions (H) of the MAP4Ks-HCIPs are shown. See also Tables S1, S2, S3, and S4.