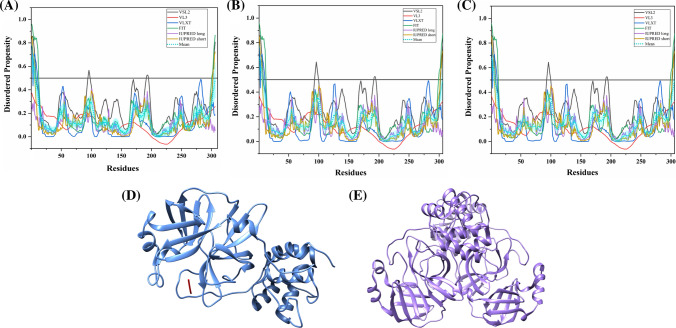
Fig. 16.
Analysis of intrinsic disorder propensity of Nsp5. Graphs a–c represent intrinsic disorder profiles of Nsp5 protein of a SARS-CoV-2, b human SARS, and c bat CoV. Colour schemes are similar to those given in Fig. 3. d A 2.16 Å X-ray diffraction-based crystal structure (PDB ID: 6LU7) of SARS-CoV-2 Nsp5 in complex with its inhibitor N3. e A 1.50 Å crystal structure (PDB ID: 5C5O) of Nsp5 of human SARS CoV

