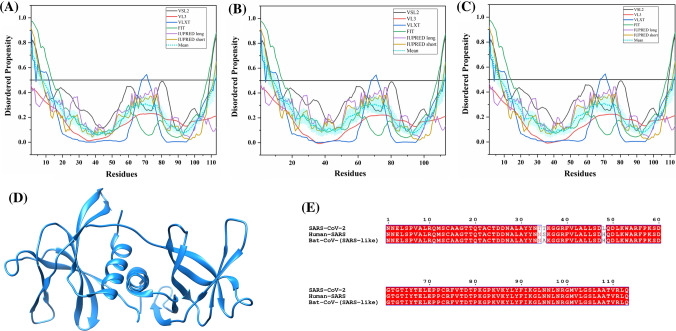
Fig. 19.
Analysis of intrinsic disorder propensity of Nsp9. Graphs a–c represent the intrinsic disorder profiles of Nsp9 protein of a SARS-CoV-2, b human SARS, and c bat CoV. d A 2.70 Å crystal structure (PDB ID: 1QZ8) of residues 3–113 of human SARS Nsp9. e MSA profile of all three Nsp9 proteins. Colour schemes are similar to those given in Fig. 3

