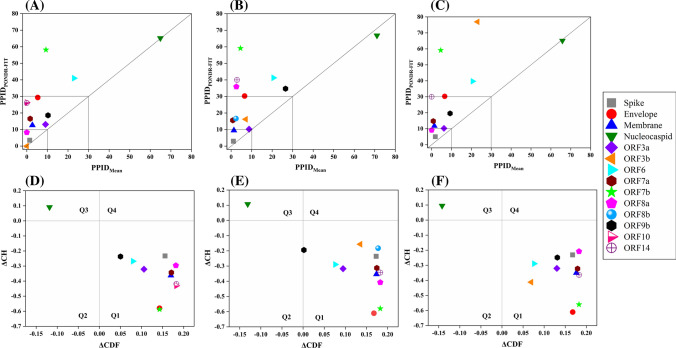
Fig. 2.
Analysis of overall disorder status of proteins of SARS-CoV-2, human SARS, and bat CoV (SARS-like): 2D plots representing PPIDPONDR-FIT vs. PPIDMean for a SARS-CoV-2, b human SARS and c bat CoV. In the CH–CDF plot of the proteins of d SARS-CoV-2, e human SARS and f bat CoV, the Y coordinate of each protein spot signifies the distance of corresponding protein from the boundary in the CH plot and X coordinate value corresponds to the average distance of CDF curve for respective protein from the CDF boundary

