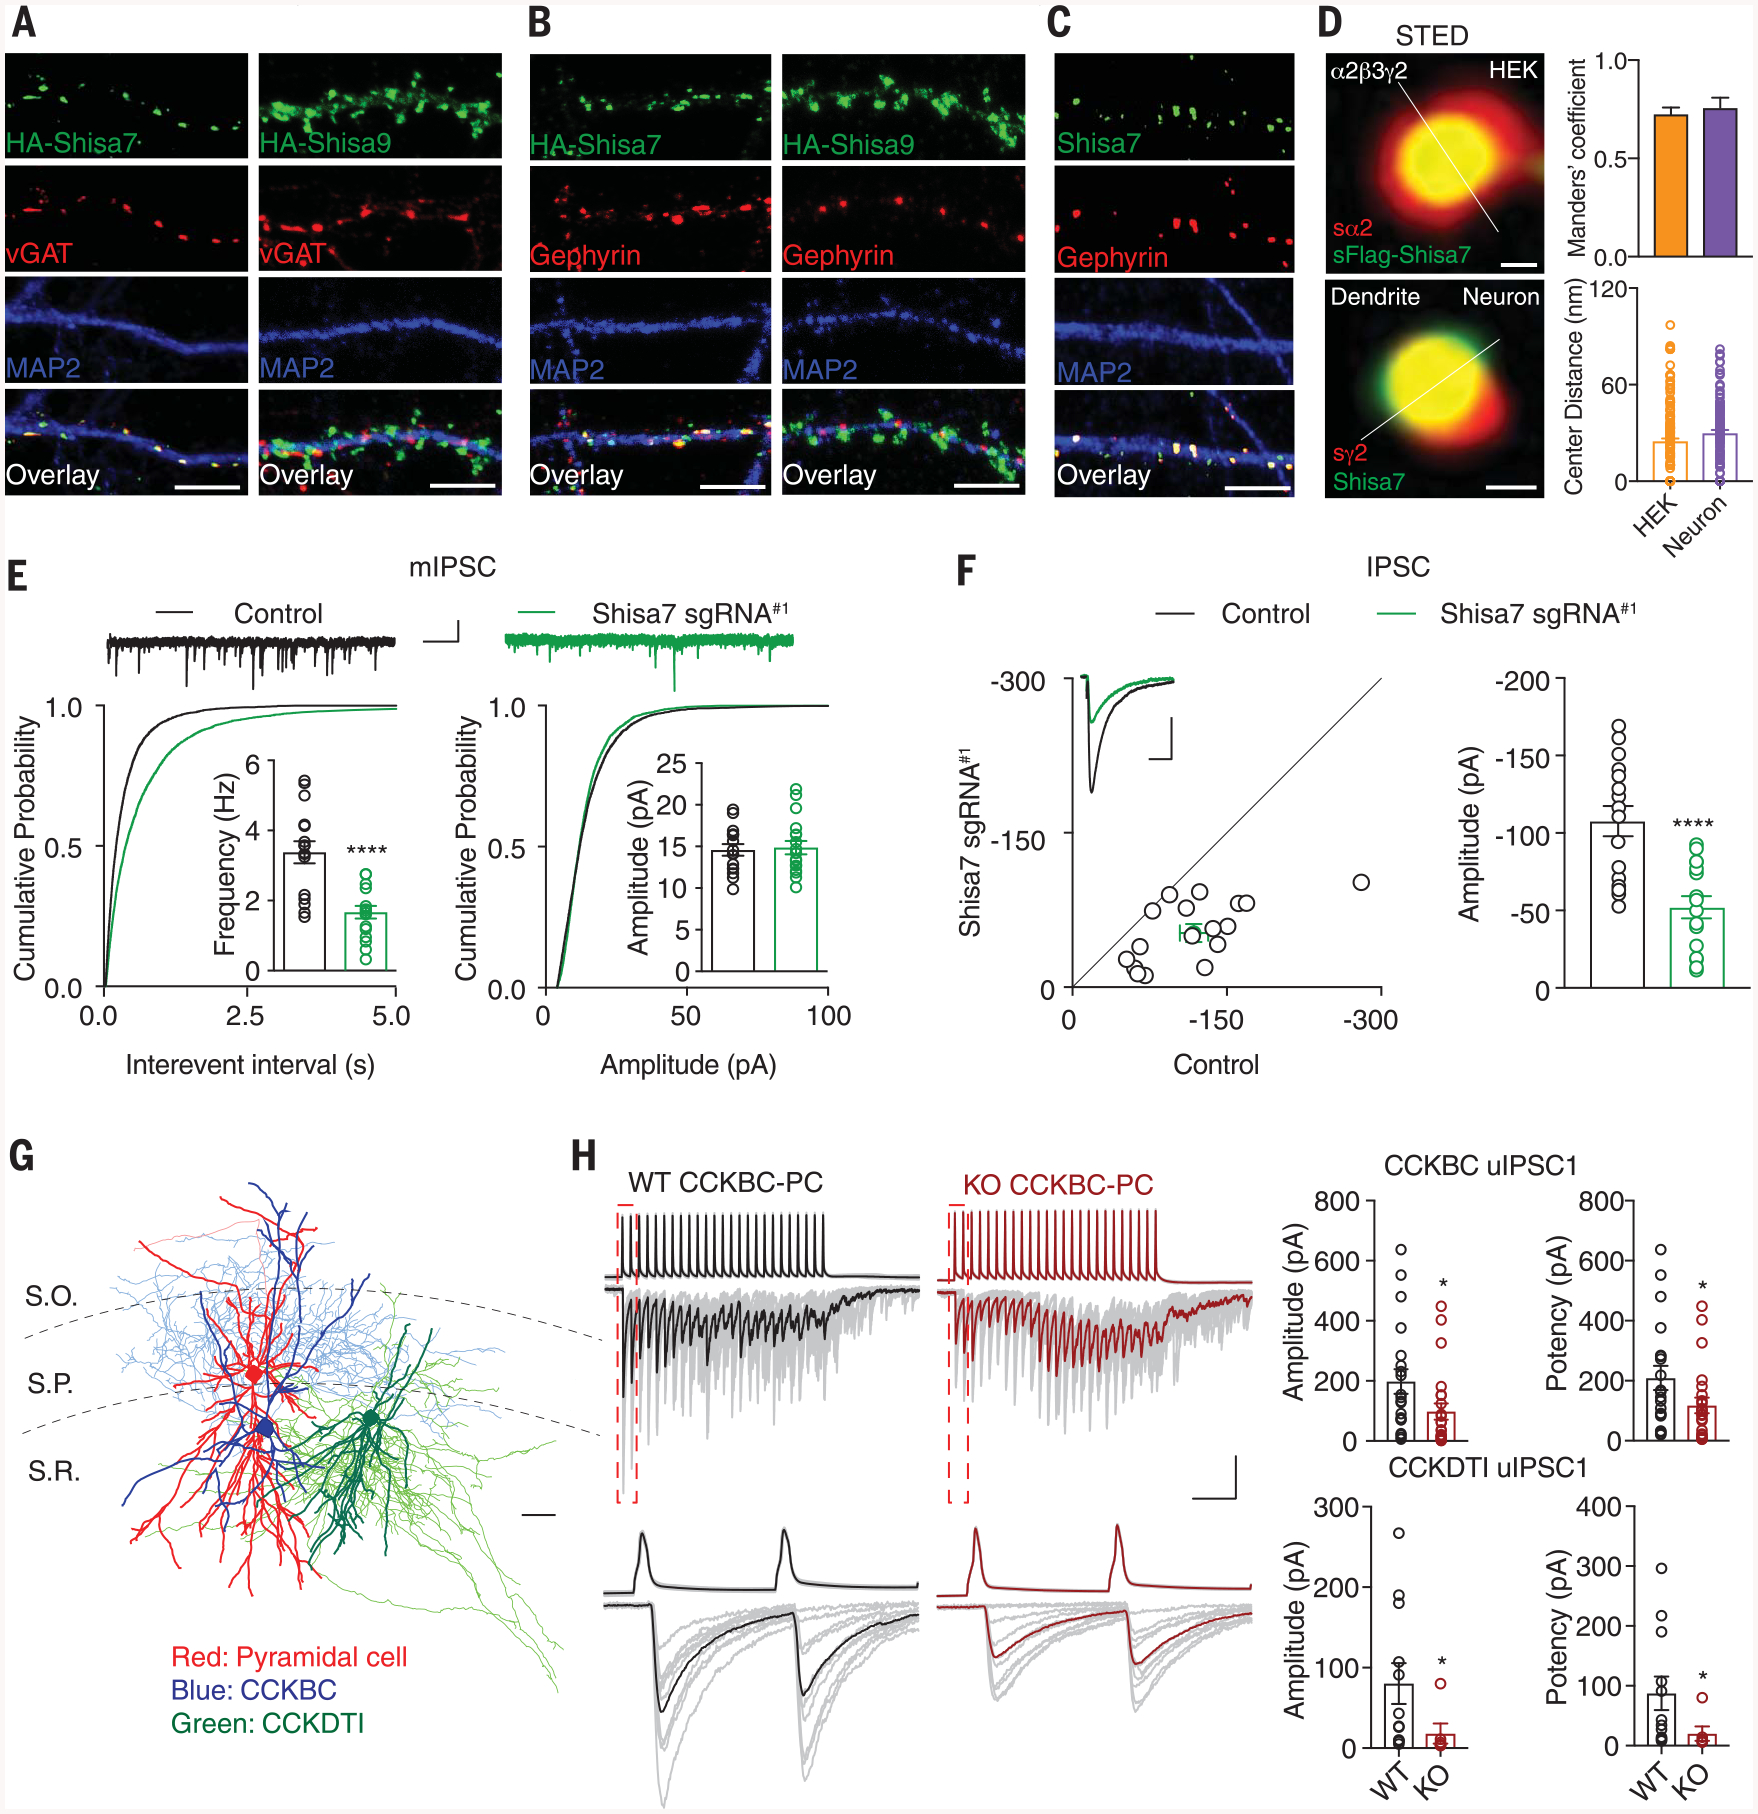
Fig. 1. Identification of Shisa7 as a critical molecule for inhibitory transmission.

(A and B) HA-Shisa7, but not HA-Shisa9, colocalized with vGAT (A) or gephyrin (B) in hippocampal neurons. Scale bar, 10 mm. (C) Endogenous Shisa7 colocalized with gephyrin in hippocampal neurons. Scale bar, 10 mm. (D) Stimulated emission depletion microscopy (STED) with the line profile analysis showed that Shisa7 and GABAAR subunits colocalized in HEK cells (n = 164 puncta, n = 8 cells) (top) and in neurons (n = 107 puncta, n = 8 neurons) (bottom). The s prefix indicates surface. Scale bar, 60 nm. (E) Single-cell KO of Shisa7 strongly reduced mIPSC frequency but not amplitude in CA1 pyramidal cells (n = 15 for both conditions; t test). Kolmogorov-Smirnov test was used for cumulative distributions. Scale bars, 20 pA and 1 s. (F) Dual recording showed that Shisa7 sgRNA#1 strongly reduced IPSCs in CA1 pyramidal cells (n = 16; paired t test). (G) Anatomical reconstructions illustrating a representative CA1 pyramidal cell (red) innervated by a CCKBC (blue) and a CCKDTI (green), used for paired recordings. Scale bar, 100 mm. S.O., stratum oriens; S.P., stratum pyramidale; S.R., stratum radiatum. (H) (Top) Sample averaged traces of CCKBC presynaptic action potentials and corresponding postsynaptic pyramidal neuron uIPSCs evoked by presynaptic stimuli in Shisa7 WT (black) and KO (red) hippocampal slices with individual sweeps shown in gray. Bars: 100 ms/100 pA or 50 mV. (Bottom) Boxed regions of trains (dashed lines in top traces) shown on an expanded time scale. Bar: 12.5 ms. On the right are summary plots of uIPSC amplitudes and potency (CCKBCs: WT n = 20, KO n = 23; CCKDTIs: WT n = 12, KO n = 6; Mann-Whitney U test). Error bars indicate SEM. ****P < 0.0001; *P < 0.05.
