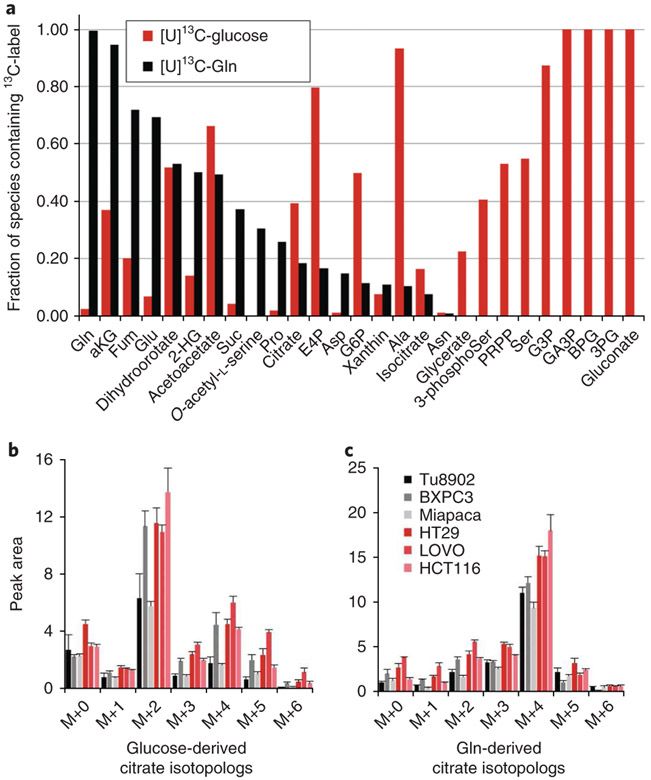
Fig. 3 ∣. Fractional labelling of central carbon metabolism in cancer cell lines with 13C-glucose and 13C-glutamine.
a, Bar plot of the fraction of 13C incorporated into a spectrum of metabolites from central carbon metabolism for both 13C6-glucose and 13C5-glutamine in murine pancreatic cancer cells. Glucose and glutamine labelling data are generated from parallel samples. b,c, The sums of all isotopologs containing label are presented as single bars. b, Isotopolog analysis of 13C6-glucose. c, 13C5-Gln incorporation into citrate across a panel of pancreatic cancer (shades of black) and colon cancer (shades of red) cell lines. Data are presented as ion current for samples normalized for loading by protein concentration in parallel samples. Gln, glutamine; Glu, glucose.

