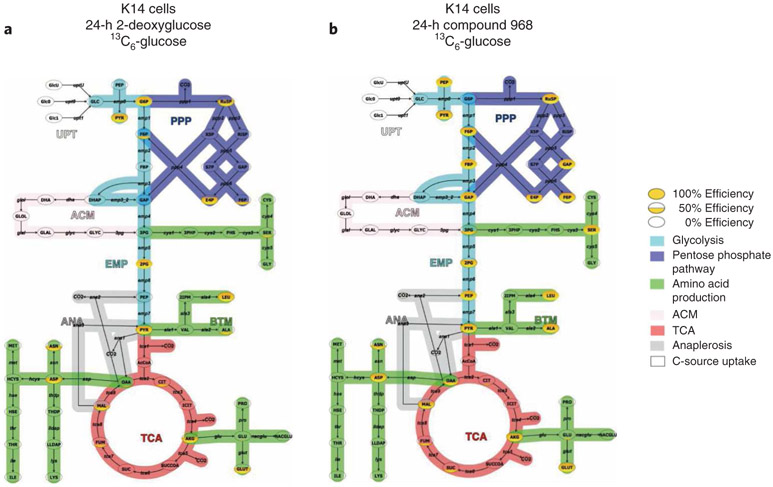
Fig. 8 ∣. Visualization of metabolic flux analyses with Omix Visualization.
a,b, Pathway map and flux of metabolite intermediates through glycolysis, TCA cycle and pentose phosphate pathway from K14 cells labeled with 13C6-glucose and treated for 24 h with the glycolysis inhibitor 2-deoxyglucose (2-DG) (a) and the TCA cycle inhibitor compound 968 (b).

