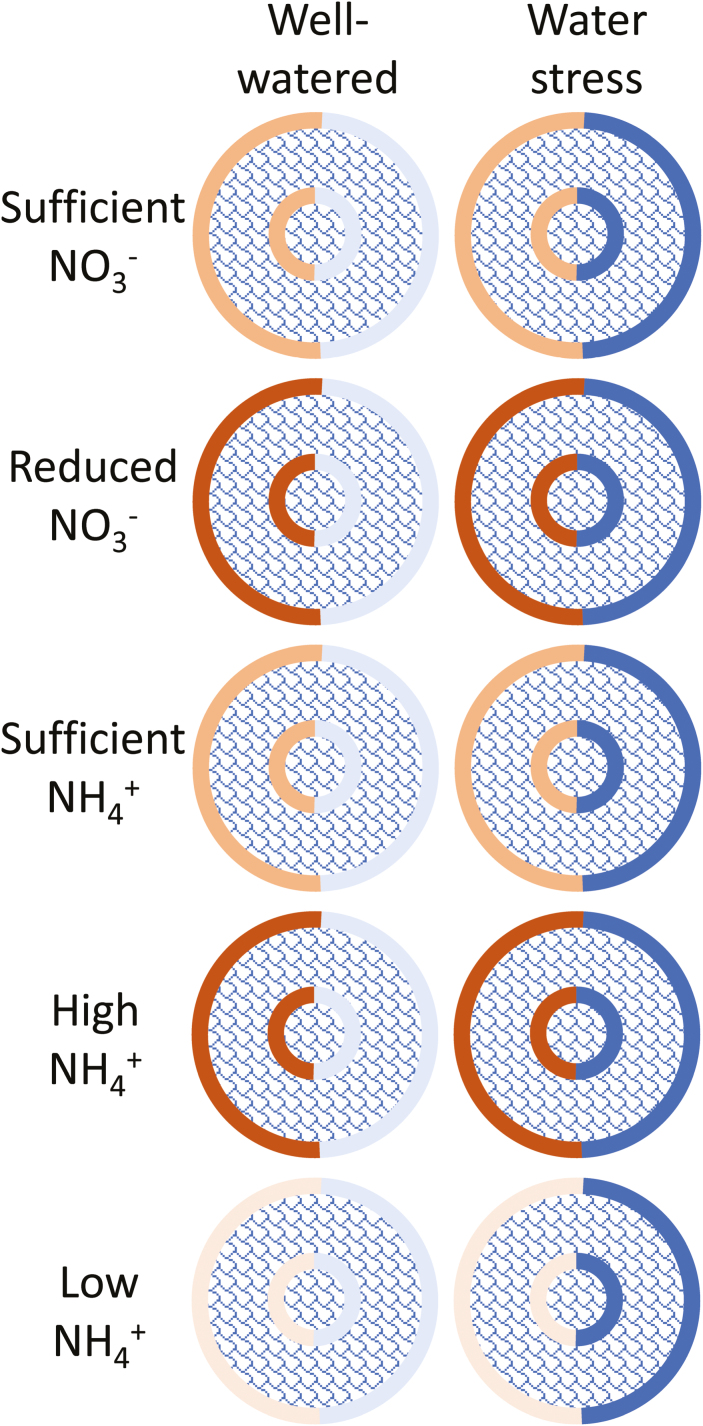
Fig. 1.
The putative impact of water and N supply on the development of plant root barriers. The outer and inner rings represent the exodermal and endodermal cell layers, respectively. The matrix represents the combinations of different water availability (columns) and different N sources and supplies (rows). Darker rings indicate induced root barriers which have increased suberin and lignin depositions in the cell walls, decreasing apoplastic water and N transport, while the reverse is depicted by lighter rings. The effect of N (left) and water (right) supply is represented on opposite sides of each ring. Future work must address whether an increase in barrier development influences N and water transport similarly, in particular where available water and N are having opposite influences on barrier development (e.g. low NH4+ combined with water stress, as depicted in the bottom right of the figure).

