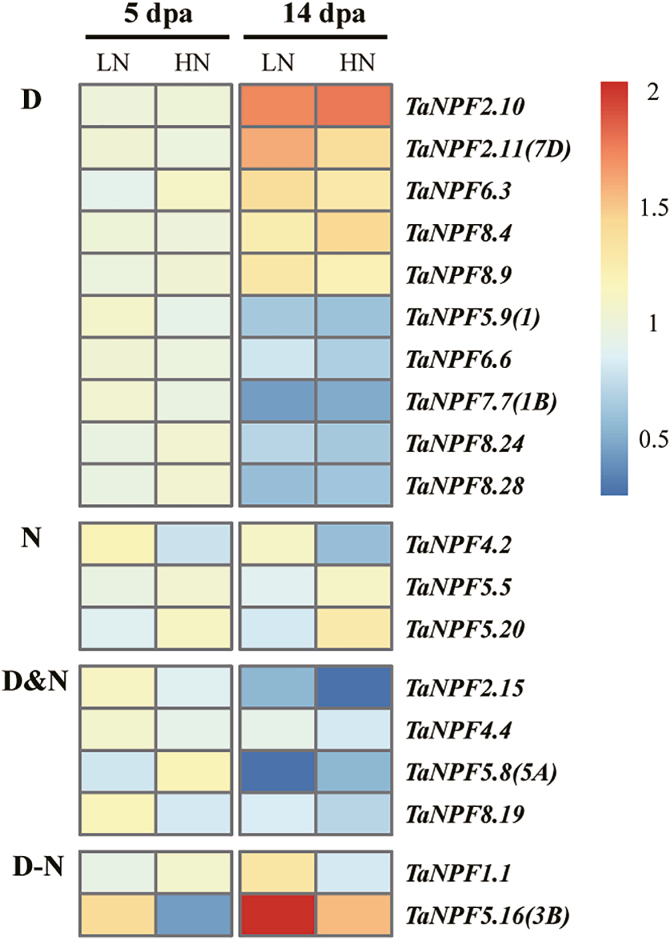
Fig. 7.
Heatmap of NPF expression profiles in the node in relation to development and N fertilization by RT–qPCR. Gene expression data were normalized for each gene and are shown as log2-transformed data of normalized data+1. dpa, days post-anthesis, LN, low nitrogen (0 kg ha–1) application; HN, high nitrogen (200 kg ha–1) application. Groups D, N, D&N, and D–N indicate development effect (D), nitrogen effect (N), development and nitrogen effects (D&N), and interacting effects of development and nitrogen (D–N) on NPF gene expression (n=3 replicates; P<0.05), respectively.

