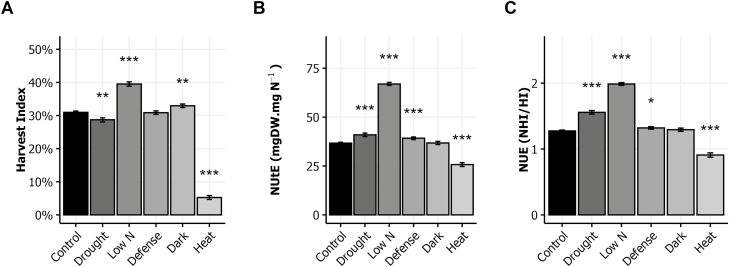
Fig. 2.
Harvest index and nitrogen use efficiency in response to environmental stresses. Plant material is the same as in Fig. 1. Harvest index (A), nitrogen utilization efficiency (NUtE, B) and nitrogen use efficiency (NUE, C) of plants growing in the six environments. The means ±SE of the eight genotypes are shown. Asterisks indicate the significance of the difference between the means of the control and stress conditions: *P<0.05, **P<0.01, ***P<0.001, n≥112.

