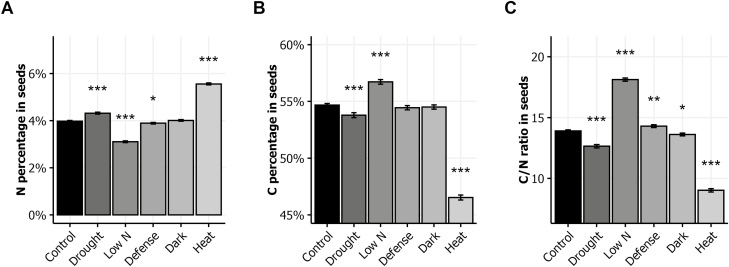
Fig. 4.
Seed composition in response to environmental stresses. N% (A), C% (B), and C/N ratio (C) in seeds of plants grown in the six environments. The means ±SE of the eight genotypes are shown. Asterisks indicate the significance of the difference between the means in the control and stress conditions: *P<0.05, **P<0.01, ***P<0.001, n≥112.

