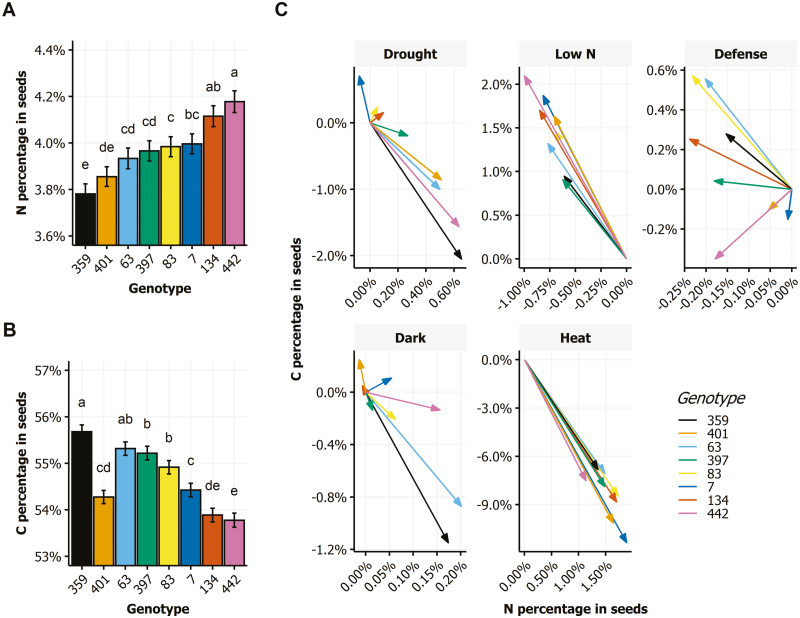
Fig. 5.
Genotype variability of seed composition among the eight genotypes in the control condition and the relative response to environmental stresses. (A, B) N% (A) and C% (B) in seeds of the eight genotypes (359, 401, 63, 397, 83, 7, 134, and 442) grown in the control condition. Letters indicate statistically significant differences (means ±SE, two-way ANOVA followed by Turkey’s test: P<0.05, n≥14). (C) Relative response vectors of the eight genotypes to the environmental stresses: drought, low N, defense, dark, and heat. Arrows represent the response vector of seed composition to stress relatively to the seed composition in the control condition.

