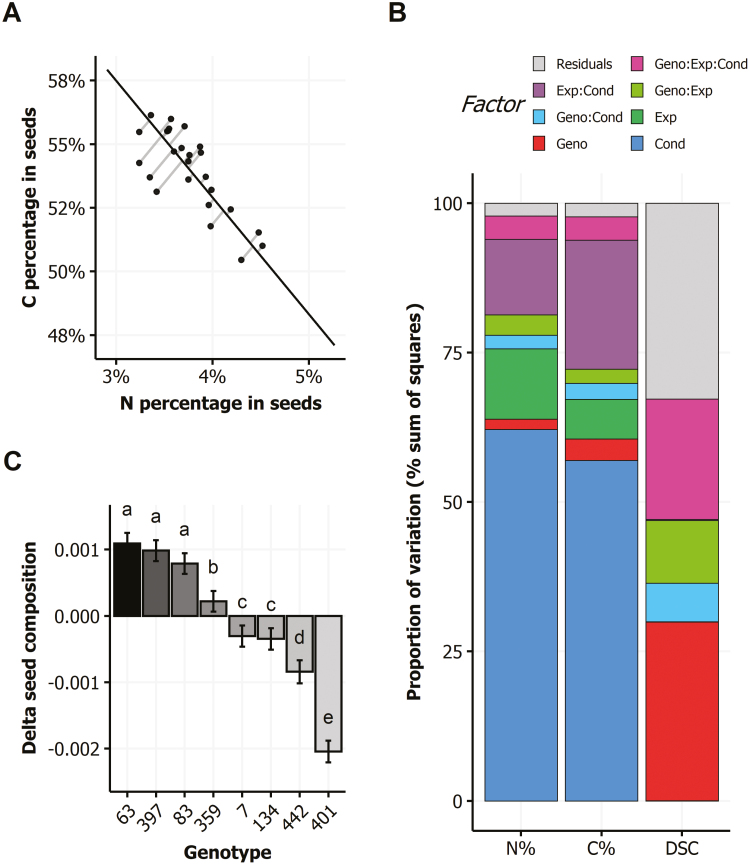
Fig. 7.
Delta seed composition (DSC). (A) The DSC of plants is the length of the grey segments that join orthogonally each plot to the black regression line; here only data from the control condition of experiment 6 are shown. (B) Proportion of variance explained by factors and interactions in ANOVA shown for N%, C%, and DSC in seeds. Bars show the effects due to genotype (Geno), condition (Cond), and experiment (Exp), and interactions as a percentage of the variation of N%, C%, and DSC in seeds. (C) Genetic variation of DSC among the eight genotypes, irrespective of growth conditions. Letters indicate statistically significant differences (means ±SE, three-way ANOVA followed by Turkey’s test: P<0.05, n≥14).

