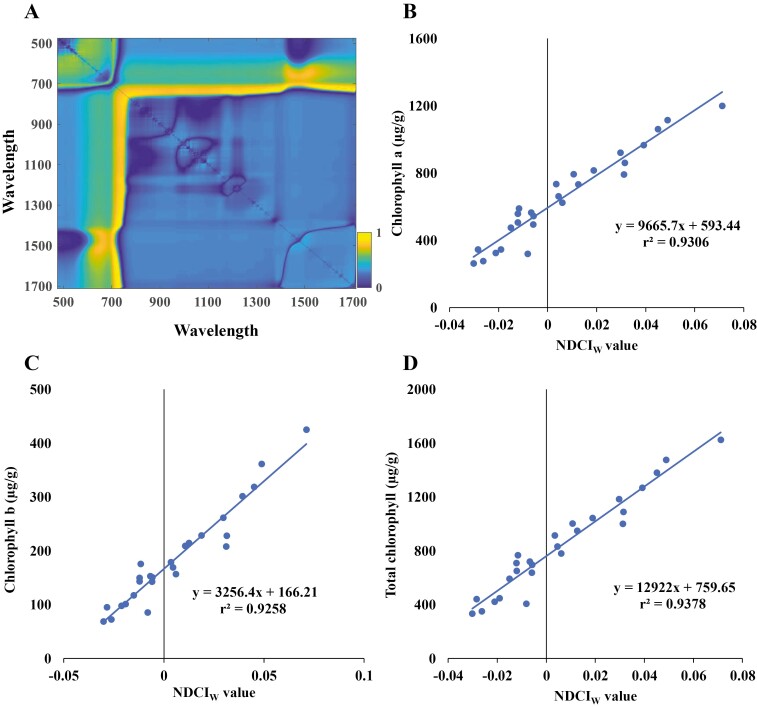
Fig. 2.
Derivation of the novel vegetation index and correlation with chlorophyll content. (A) Correlation map plot generated using the brute-force indices mining approach in Metlab. (B) Chlorophyll a, (C) chlorophyll b, and (D) total chlorophyll linear training model correlation with the novel vegetation index, normalized difference chlorophyll index in wheat (NDCIW).

