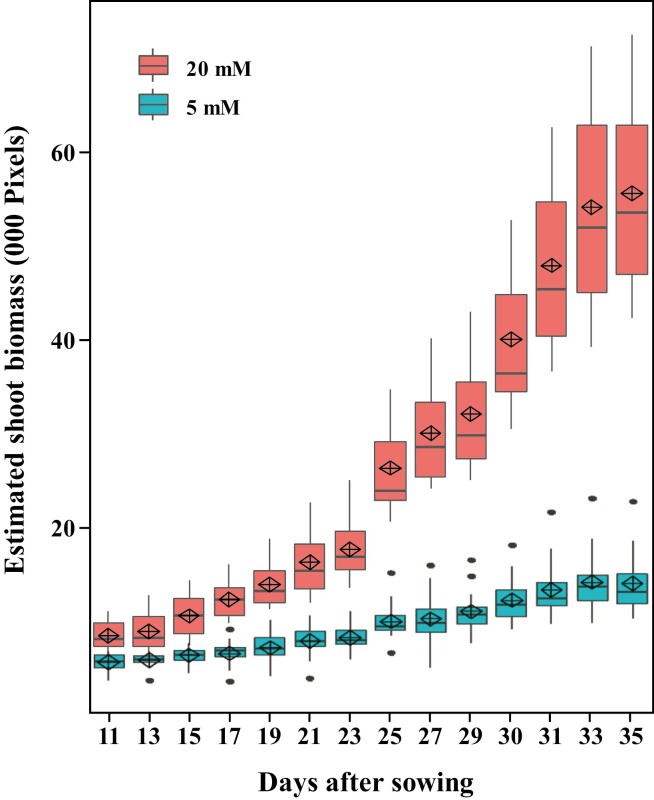
Fig. 4.
Dynamic growth rate of wheat at varying N levels. Box plot showing the estimated shoot biomass accumulated during the vegetative growth period of plants supplied with 20 and 5 mM N, derived from digital imaging at Plant Phenomics Victoria, Horsham. The black horizontal line represents the median; the diamond indicates the mean; the upper and lower limits of the bounding box represent the 75th and 25th percentiles, respectively; the whiskers extend to the maximum and minimum values excluding outliers, which are plotted individually. (This figure is available in colour at JXB online.)

