FIGURE 4.

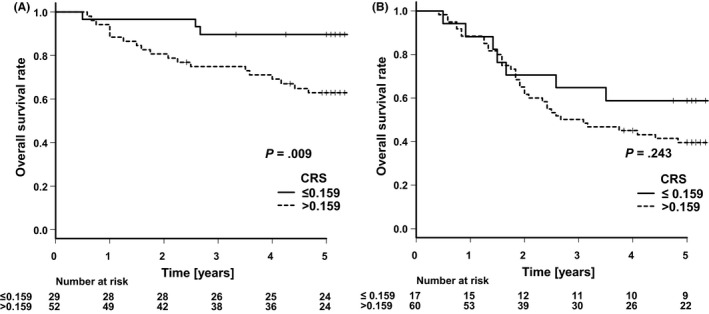
Kaplan–Meier analyses of overall survival comparing the elderly patients with CRS ≤ 0.159 and those with CRS > 0.159 in pStage II gastric cancer (A) and pStage III gastric cancer (B)

Kaplan–Meier analyses of overall survival comparing the elderly patients with CRS ≤ 0.159 and those with CRS > 0.159 in pStage II gastric cancer (A) and pStage III gastric cancer (B)