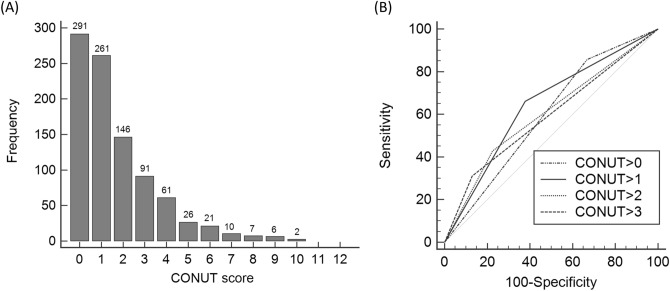
Figure 1.
Frequency distribution of CONUT scores and comparison of the area under the ROC curve for PPCs predictability of the CONUT depending on different cut-off values. (A) Distribution of the study population depending on CONUT score. Approximately half of the study population had a CONUT score of 0 or 1 (452 of 922, 49.0%). (B) ROC curves for PPCs according to the various cut-off values of CONUT. The AUCs were 0.594 (CONUT > 0), 0.642 (CONUT > 1), 0.601 (CONUT > 2), and 0.591 (CONUT > 3). AUC area under curve, CONUT controlling nutritional status, PPCs postoperative pulmonary complications, ROC receiver operating characteristic, CI confidence interval.

