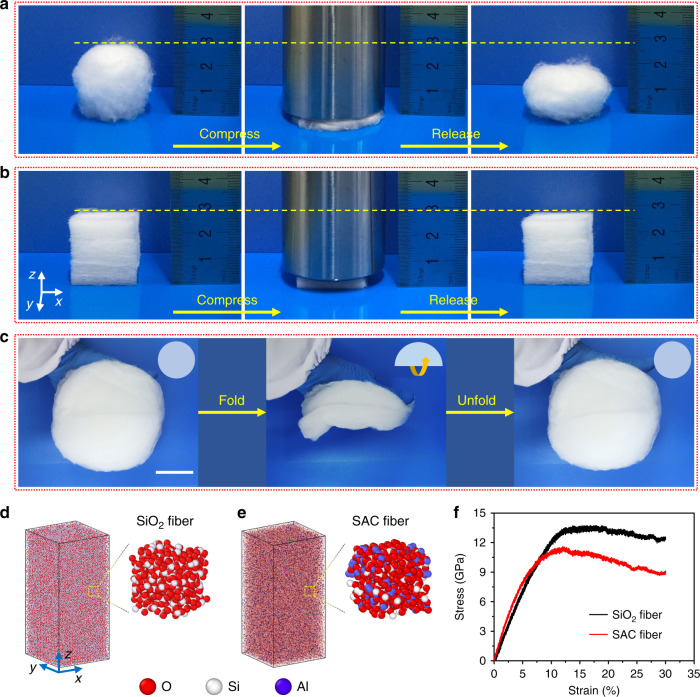
Fig. 3. Flexibility and mechanical compressibility of the SiO2 and SAC sponges.
a Photographs of an SiO2 sponge before compression, during compression, and after release. b Photographs of an SAC sponge before compression, during compression, and after release. c Photographs showing the flexibility of the SAC sponges. The schematics in the top right corner of the photographs are used to show the folding and unfolding of the samples. Scale bar in c, 5 cm. Atomistic models of d SiO2 fiber and e SAC fiber. f Stress–strain curves from the molecular dynamics simulations of the SiO2 fibers and SAC fibers under uniaxial tension.

