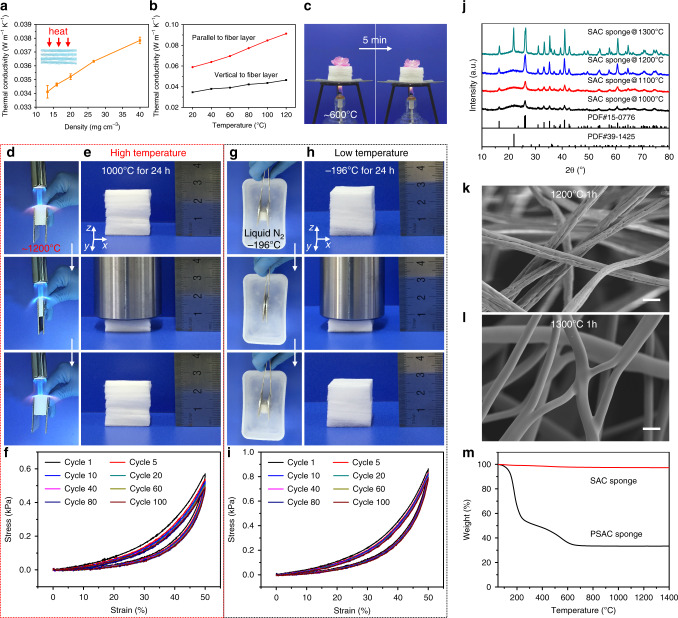
Fig. 5. Thermal properties of the SAC sponges.
a Thermal conductivity of SAC sponges with different densities. The inset is the schematic showing the heat flow direction during the thermal conductivity determination. Error bars represent s.d. (n = 3). b Thermal conductivity of the SAC sponges with a density of 16 mg cm−3 along different fiber layer directions at different temperatures. c Thermal insulation performance of the SAC sponges at high temperature; this figure shows how an SAC sponge prevents a fresh flower from withering when heated with an alcohol lamp. d Photographs showing the compressibility and fire resistance of the SAC sponges burned with a butane blowlamp. e Photographs showing the high compressibility of the SAC sponges treated at 1000 °C for 24 h. f Compressive stress–strain curves of the SAC sponges treated at 1000 °C for 24 h at 50% maximum strain for different numbers of cycles. g Photographs showing the compressibility of the SAC sponges immersed in liquid N2. h Photographs showing the high compressibility of the SAC sponges kept in liquid N2 for 24 h. i Compressive stress–strain curves of the SAC sponge kept in liquid N2 for 24 h at 50% maximum strain for different numbers of cycles. j XRD patterns of the SAC sponges calcinated at 1000, 1100, 1200, and 1300 °C for 1 h. SEM images of the SAC sponges obtained by calcination at k 1200 °C and l 1300 °C for 1 h. Scale bars in k and l, 5 μm. m Thermogravimetric analysis of the SAC sponges and PSAC sponges in air.

