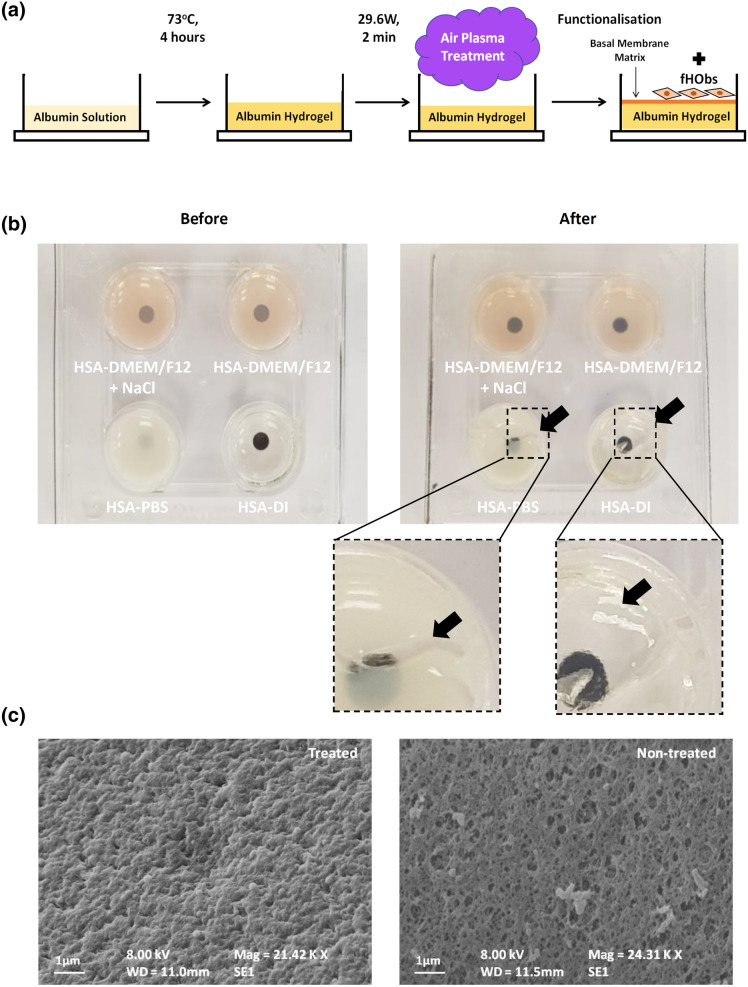
Figure 1.
(a) Schematic representation of hydrogel preparation and functionalisation. (b) Hydrogels formed by dissolving HSA in DMEM/F12 with additional sodium chloride (top left), DMEM/F12 (top right), PBS (bottom left) and DI (bottom right). Left panel: before plasma treatment, right panel: after plasma treatment. Black dots printed on paper beneath the well-plate to demonstrate hydrogel opacity. Black arrows point at regions where the hydrogels failed after plasma treatment. (c) SEM images of HSA-DMEM/F12 hydrogel surfaces; plasma-treated and non-plasma treated surfaces.

