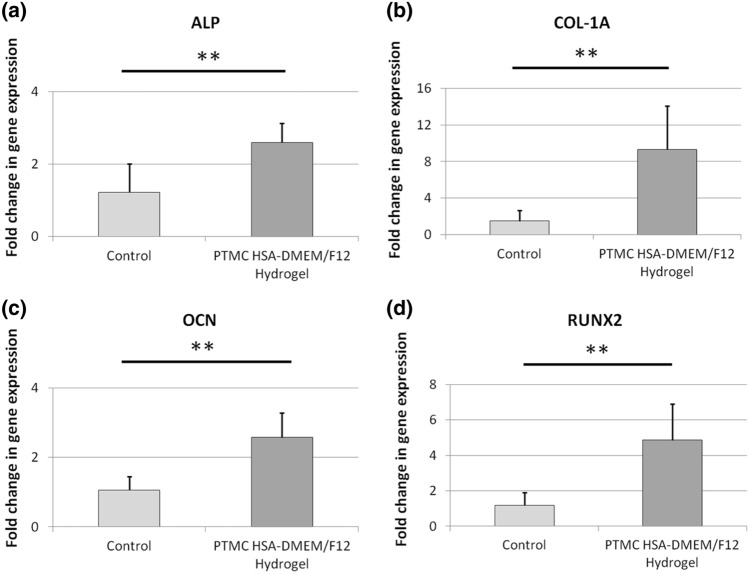
Figure 5.
Gene expression analysis of fHObs cultured on plasma-treated, matrix-coated (PTMC) HSA-DMEM/F12 hydrogels at day 8 of culture (a) ALP, (b) COL1-A1, (c) OCN and (d) RUNX2. Control samples are fHObs cultured on tissue cultured treated plates and harvested at Day 1. Due to poor cell attachment, insufficient RNA was extracted from fHObs cultured on plasma-treated, uncoated HSA-DMEM/F12 hydrogels. Statistically significant differences were displayed as **p < 0.01, and derived by independent t-tests. Data represented as mean ± standard deviation.

