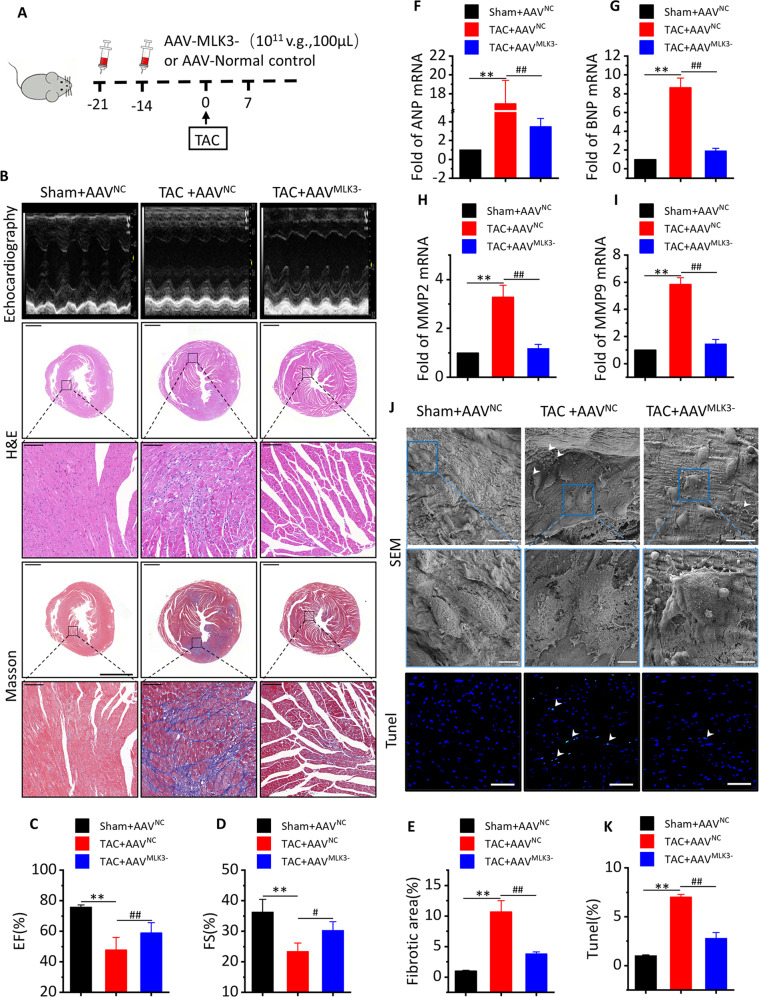
Fig. 3. Inhibition of MLK3 improves cardiac function and inhibits pyroptosis in day 7 of TAC.
a Schematic outline of experiments performed in panels. Mice were in administration of AAV-MLK3 (1011 v.g.,100 μL, 14 and 21 days before TAC surgery, until 7 days after TAC) or AAV-NC. Sham group was injected AAV-NC. b Representative M-mode echocardiography recordings (upper row), H&E stained sections of heart (middle row) and sections of Masson’s trichrome-stained heart tissue (middle row)), quantitative analysis of the collagen area/left ventricular (below Masson’s trichrome staining) in Sham + AVVNC, or TAC + AVVNC or TAC + AVVMLK3- mice after 1 week. the lower scale bar indicates 1 mm, and the higher scale bar indicates 100μm. c–e Echocardiographic parameters: EF% (c), FS% (d) and fibrotic area (e) of Sham + AVVNC, TAC + AVVNC or TAC + AVVMLK3− mice after 1 week. n = 5 for each group. Mean ± SEM, fibrotic area control values were set to 1. **P < 0.01 vs sham-AVVNC, #P < 0.05, ##P < 0.01 vs TAC + AVVNC by one-way ANOVA followed by Tukey’s multiple comparisons test. Transcript level of ANP (f) and BNP (g), as determined by qRT-PCR. Transcript level of MMP2 (h) and MMP9 (i), as determined by qRT-PCR. n = 5. Mean ± SEM, **P < 0.01 vs Sham + AVVNC, ##P < 0.01 vs TAC + AAVNC by one-way ANOVA followed by Tukey’s multiple comparisons test. j Representative images of SEM (upper row, the lower SEM scale bar indicates 15 µm, and the higher SEM scale bar indicates 5 µm) and dead cardiomyocytes in a section of mice heart measured by TUNEL staining (bottom row) from Sham + AVVNC, TAC + AVVNC, or TAC + AVVMLK3 mice after 1 week. Green staining (see white arrows) indicates dead cells (blue, nucleus. Scale bar, 100 μm). k Quantification of TUNEL assay, n = 5. Mean ± SEM, **P < 0.01 vs Sham + AVVNC, ##P < 0.01 vs TAC + AAVNC by one-way ANOVA followed by Tukey’s multiple comparisons test.

