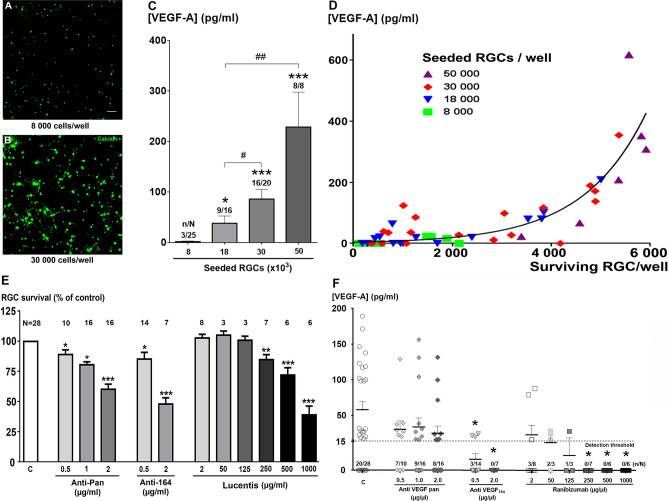
Figure 2.
Autocrine VEGF release by retinal ganglion cells (RGCs). (A,B) Representative confocal images showing live calcein-positive RGCs (6 DIV) with an initial low seeding density (8000 cells/well; A) vs. high density (30,000 cells/well; B). Scale bar represents 50 µm. (C) VEGF-A164 concentrations in supernatants from cultured RGCs after 6 DIV, depending on the seeding density. Data are expressed as pg/ml and the means ± SEM from independent cultures with n/N referring to the number of experiments with detectable VEGF A164 (n) over the total number of experiments (N). *p < 0.05, **p < 0.01 and ***p < 0.001 as compared to the seeding density of 8 × 10³; #p < 0.05 and ##p < 0.01 between indicated groups (Kruskal–Wallis ANOVA followed by the Dunn’s post-hoc test). (D) Correlation between the measured VEGF-A164 concentration and the actual number of surviving RGCs. The initial seeding densities were 8000 cells/well (green, n = 22), 18,000 cells/well (blue, n = 15), 30,000 cells/well (red, n = 15) or 50,000 cells/well (purple, n = 5). The non-linear regression curve is fitted with an exponential growth equation (r2 = 0.65) and a significant correlation was evidenced (p < 0.001, Spearman test). (E) Suppression of RGC neuroprotection by VEGF-A traps added into the control culture medium: non-selective anti VEGF-A (pan antibody for VEGF isoforms), selective anti-VEGF-A164 antibody, and the anti-VEGF Fab fragment ranibizumab. N refers to the total number of experiments in each group. (F) VEGF-A164 concentrations (in pg/ml) in supernatants from RGC cultures (6 DIV) in the presence of various concentrations of three VEGF traps: anti-pan VEGF-A, anti-VEGF-A164, or the VEGF trap ranibizumab. n/N refers to the number of experiments with detectable VEGF A164 (n) over the total number of experiments (N). *p < 0.05 as compared to the control (C) group (Kruskal–Wallis ANOVA followed by the Dunn’s post-hoc test). RGCs were seeded at initial density of 30,000 cells/ well in E,F.

