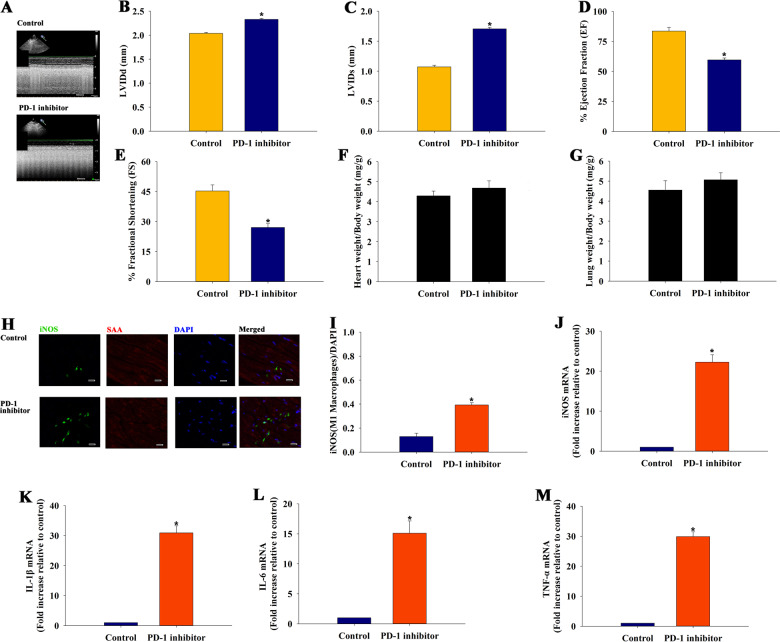
Fig. 1. PD-1 inhibitor impaired the heart function accompanied by the inducement of differentiation of M1 macrophages.
a Representative images of echocardiography exhibiting changes in cardiac function in each group. Echocardiographic analysis of left ventricular end-diastolic diameter (LVIDd) b, left ventricular end-systolic diameter (LVIDs) c, ejection fraction (EF) d, and fractional shortening (FS) e in week 4 after the first cycle of PD-1 inhibitor treatment or sham operation, n = 6 per group. f Ratio of heart weight to body weight. g Ratio of lung weight to body weight; n = 6 per group. h Representative photomicrographs of iNOS. i Quantitative analysis of iNOS-positive M1 proinflammatory macrophages, n = 3 per group; Scale bar: 50 μm. Proinflammatory cytokine iNOS j, IL-1β k, IL-6 l, and TNF-α m mRNA expression levels were examined using qRT-PCR, n = 6 per group. *P < 0.05 versus the control group.

