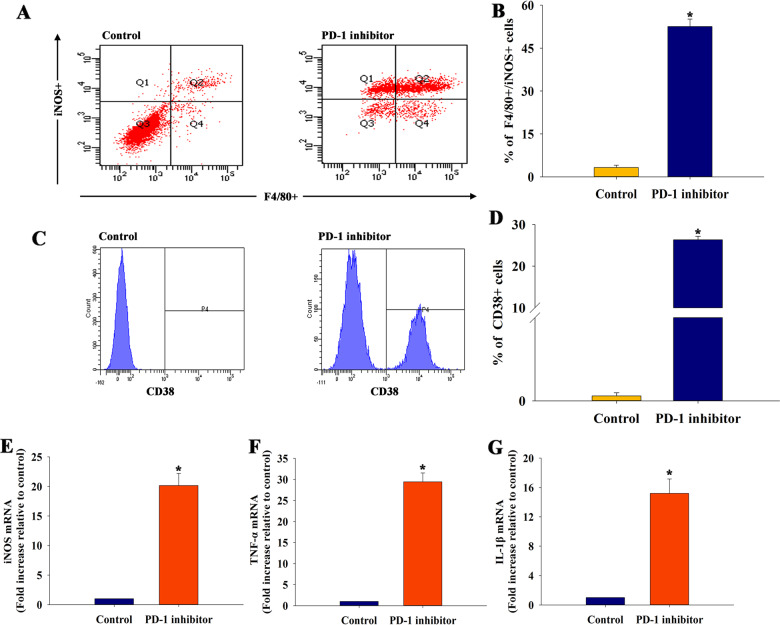
Fig. 4. PD-1 inhibitor regulated macrophage polarization to the M1 phenotype in vitro.
a The typical results of F4/80+/iNOS+ type using flow cytometry in macrophages treated with conditioned medium with or without a PD-1 inhibitor for 3 days. b Quantitative analysis of F4/80+/iNOS+ cells were analyzed using flow cytometry. c The typical results of CD38+ type using flow cytometry in macrophages treated with conditioned medium with or without a PD-1 inhibitor for 3 days. d Quantitative analysis of CD38+ cells were analyzed using flow cytometry. n = 3 per group. The expression levels of M1 markers iNOS e, TNF-ɑ f, and IL-1β g mRNAs were examined using qRT-PCR. n = 6 per group. *P < 0.05 versus the control group.

