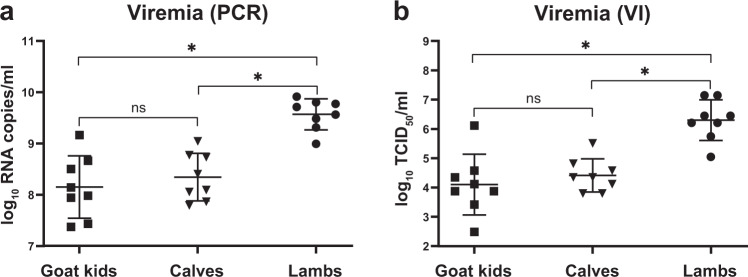
Fig. 6. Comparison of peak viremia of mock-vaccinated goat kids, calves and lambs.
Peak viremia, as detected by PCR (a) or virus isolation (b) of mock-vaccinated animals. For calves and lambs, values measured at 3 days post challenge are plotted, and for goat kids, values measured at 2 days post challenge. Each symbol depicts the value from an individual animal. Statistical significance of the differences between the groups was determined by one-way ANOVA with Tukey test for multiple comparison, (ns) not significant, asterisk (*) significant with a p value ≤ 0.05. Error bars represent s.d.

