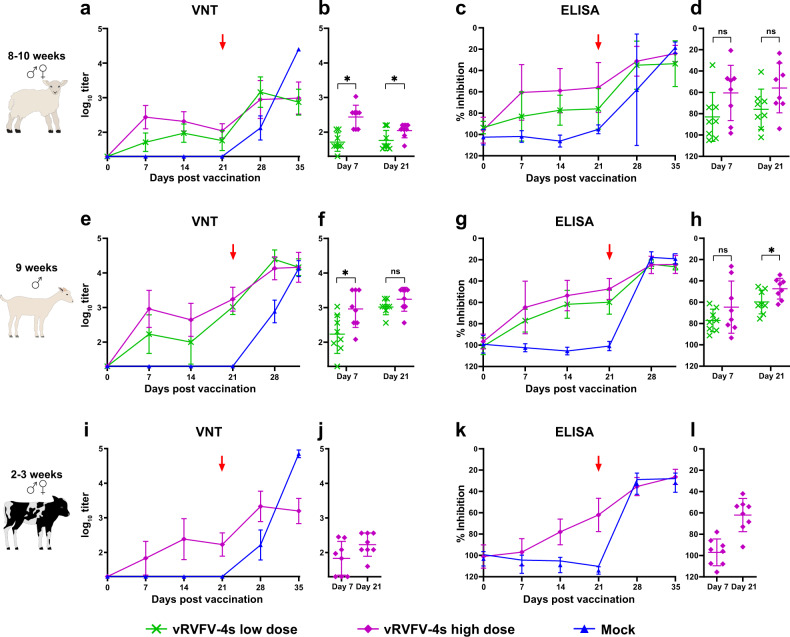
Fig. 7. Serology results of the vRVFV-4s efficacy trials.
Neutralizing antibody responses in time as determined by VNT (a, e, i). Challenge (red arrow) of both groups was on DPV 21. Statistical analysis by unpaired T-test of the VNT responses 1 week post vaccination and at the day of challenge (b, f, j). Detection of anti-N antibodies by ELISA in weekly obtained sera (c, g, k). Titres are expressed as percentage competition ratio of the optical densities (OD) of the sample and the OD of the negative control (% S/N). All values below 40% are considered positive, between 40 and 50% are considered doubtful and above 50% are considered negative. Statistical analysis by unpaired T-test of the N-ELISA responses 1 week post vaccination and at the day of challenge (d, h, l), (ns) not significant, asterisk (*) significant with a p value ≤ 0.05. Measurements were taken from distinct samples. Error bars represent s.d.

