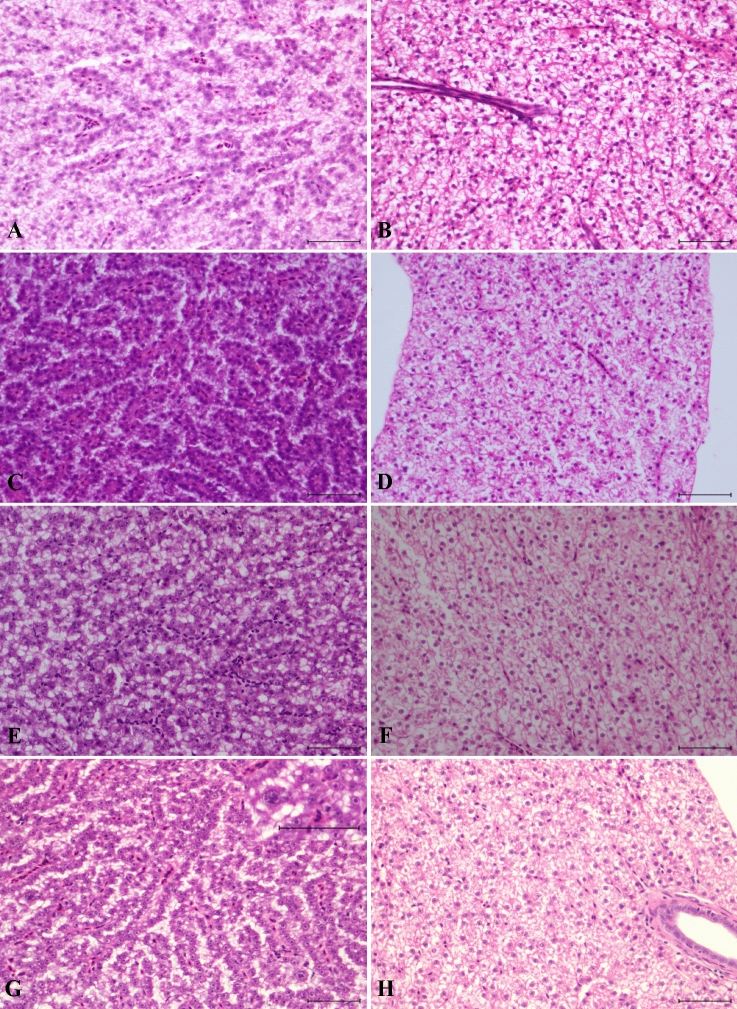
Figure 5.
Liver sections from fish fed fluorescent MPs. Control livers were sampled thirty days after the beginning of the experiment from (A) a female showing mild to moderate vacuolation and (B) a male with mild to moderate vacuolation. Thirty days after the start of the experiment: (C) female with minimal vacuolation and (D) male with mild to moderate vacuolation. Forty-five days after the start of the experiment: (E) females with mild vacuolation and (F) females with mild to moderate vacuolation. Post-depuration: (G) female with mild vacuolation, showing occasional nuclear enlargement (karyomegaly) (see inset, scale bar = 50 µm), and (H) male with mild vacuolation (scale bar = 100 µm, H–E).

