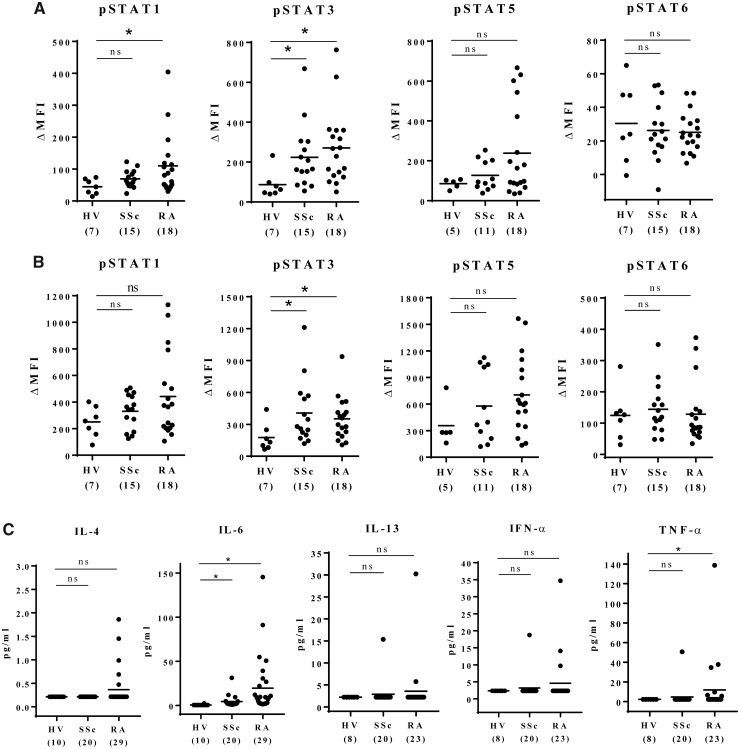
Fig. 1.
Constitutive activation of STATs in peripheral blood mononuclear cells from patients with RA and SSc
Basal phosphorylated STATs level in CD3+ T-cells (A) and in monocytes (B). (C) Plasma cytokine levels were assessed by bead-based immunoassays. Samples with cytokine levels that were below the assay’s lower limit of detection were assigned the values of the midpoint between the lower limit of detection and zero. The horizontal bars in the figure indicate the means. Numbers in brackets on the abscissa represent the number of subjects in each group. Statistical analyses were performed using Dunn’s multiple comparisons test (HV vs SSc, HV vs RA). *P < 0.05. HV: healthy control; ns: not significant; MFI: mean fluorescence intensity; STAT: signal transducer and activator of transcription.

