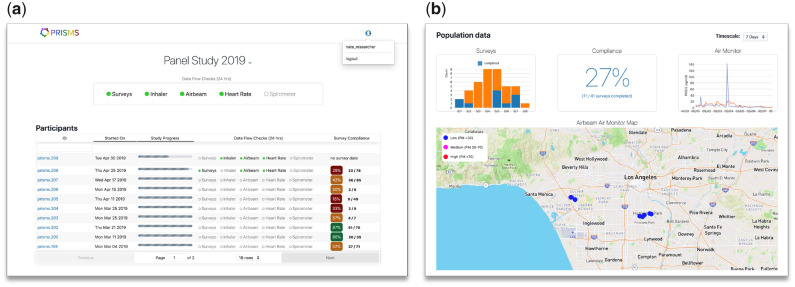
Figure 3.
BREATHE real-time dashboards supporting the implementation of epidemiological studies. To facilitate study recruitment and monitoring processes we created specific interfaces to expedite subject enrollment and troubleshooting. (A) An overall screen shows subject enrollment and a snapshot of each participant’s status toward a snapshot of each participant’s status toward study completion, the status of data transmission from their sensors, as well as the rate of EMA survey completion. Color coding and progress bars are used to provide visual cues to quick gage study progress. (B) An aggregate view of all participants’ data currently being monitored. The “air monitor” panel shows the time-series of personal PM2.5 concentrations from two ongoing participants (blue and orange lines) being monitored simultaneously in this example. Similarly, the map illustrates GPS data transmission with concurrent levels of PM2.5 being measured, at a coarse spatial resolution to protect privacy. This overview interface allows study researchers to drill-down into specific subjects. BREATHE: Biomedical REAl-Time Health Evaluation; EMA: ecological momentary assessment; GPS: global positioning system; PM: particulate matter.

