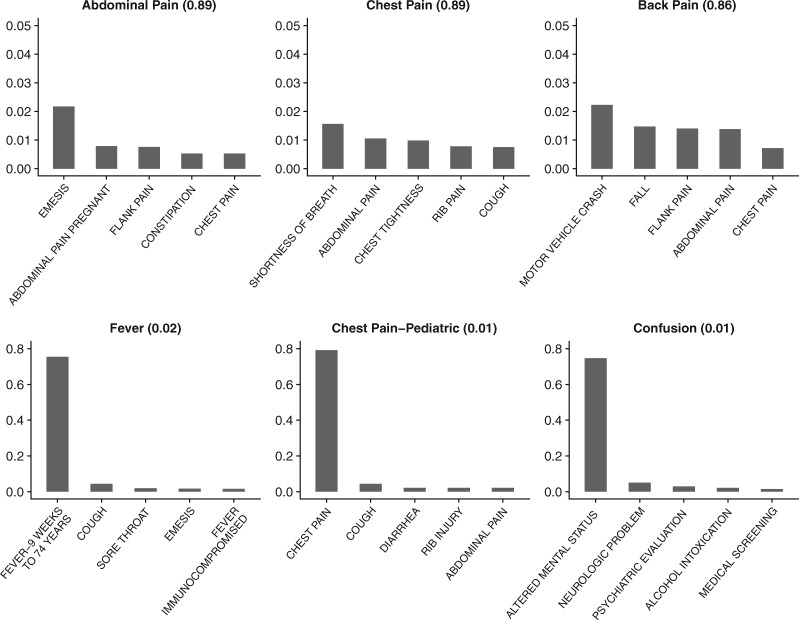
Figure 2.
Common types of mislabeling for select chief complaint labels. Top row shows three of the most common chief complaint labels, with their accuracies shown within parentheses. Bottom row shows three chief complaint labels with lowest accuracies. X-axis shows the top five most common misclassifications in decreasing order. Y-axis shows frequency of error. Note that even for low performing chief complaint labels, a high percentage of errors are due to semantic overlap.

