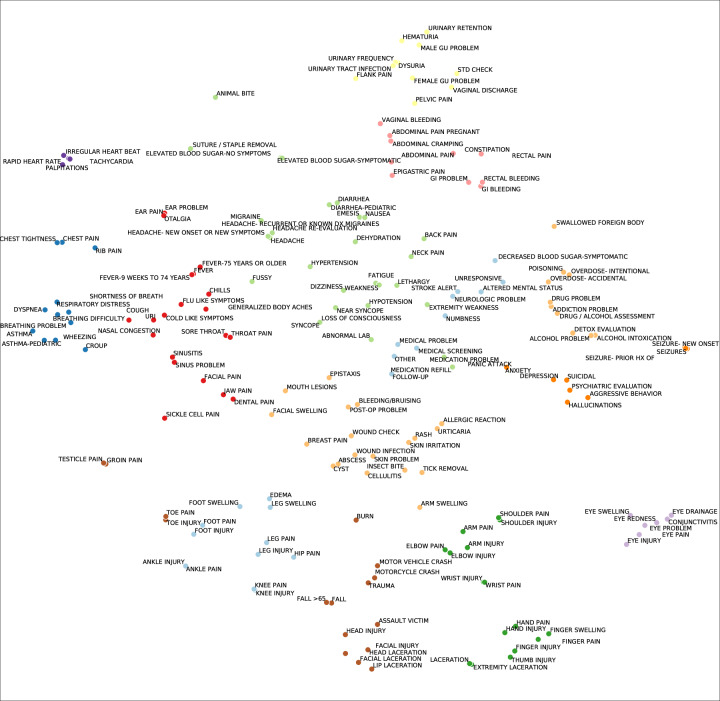
Figure 3.
t-SNE visualization of averaged embeddings of common chief complaints. Embeddings for common chief complaints were grouped by their ground truth label, then their arithmetic mean visualized using t-SNE. The embeddings are distributed in a clinically meaningful way, with related concepts embedded close to each other and broader types of chief complaints clustered together. Note that t-SNE is a stochastic algorithm and, while it preserves local structure of the data, does not completely preserve its global structure. The text labels have been jittered to enhance readability. Colored groupings represent clusters as determined by gaussian mixture modeling.

