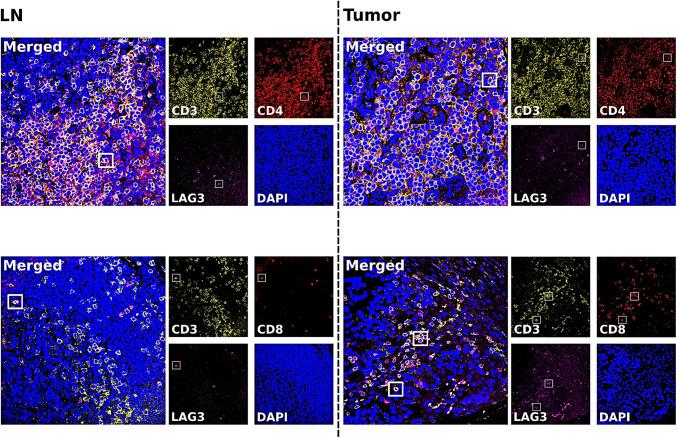
Fig. 3.
Immunofluorescence of multicolour staining for LAG3 (purple signals), CD3 (yellow signals), CD4 and CD8 (red signals) and counterstaining of the nuclei with DAPI (blue signals). a, b Show normal lymph node tissue; in a with high expression of CD3 and CD4 and single-cell co-expression with LAG3; in b single cells positive for LAG3 co-expressed CD3 and CD8. c, d Show tumour tissue with surrounding immune cells; in c the co-expression of LAG3 with CD3 and CD4 is seen; in d LAG3 positive cells are positive for both CD3 and CD8

