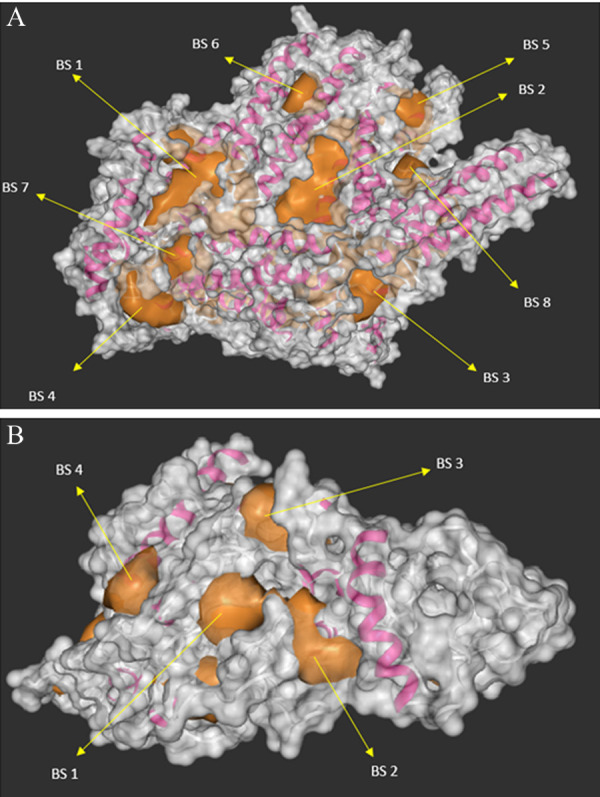
Fig 2.

3-D protein structure of AKAP3 and PLOD3 genes. Illustration of the modelled 3D structure and available target protein of different binding sites with α-chain and β-sheets (magenta), binding pocket (golden) and surface structure visualization (grey) of A. AKAP3 and B. PLOD3 protein structure binding sites are represented by arrow (→).
