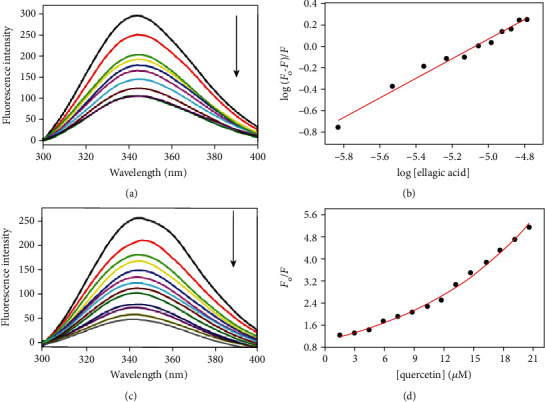
Figure 8.

Fluorescence binding study of CaMKIV with quercetin and EA. (a) Fluorescence spectra of CaMKIV (4 μM) with increasing concentrations of EA (from top to bottom) at pH 7.4. (b) Stern-Volmer plot obtained by plotting fluorescence intensity at λmax as a function of EA and fitting to Equation (1). (c) Fluorescence spectra of CaMKIV (4 μM) with increasing concentrations of EA (from top to bottom) at pH 7.4. The excitation was kept constant at 280 nm and the emission spectra was acquired from 300 to 400 nm. (d) Stern-Volmer plot obtained by plotting fluorescence intensity at λmax as a function of quercetin fitting to Equation (2).
