
Figure 3. A Novel Motif, HERM, Is Enriched at Heme-Regulated Chromatin Sites.
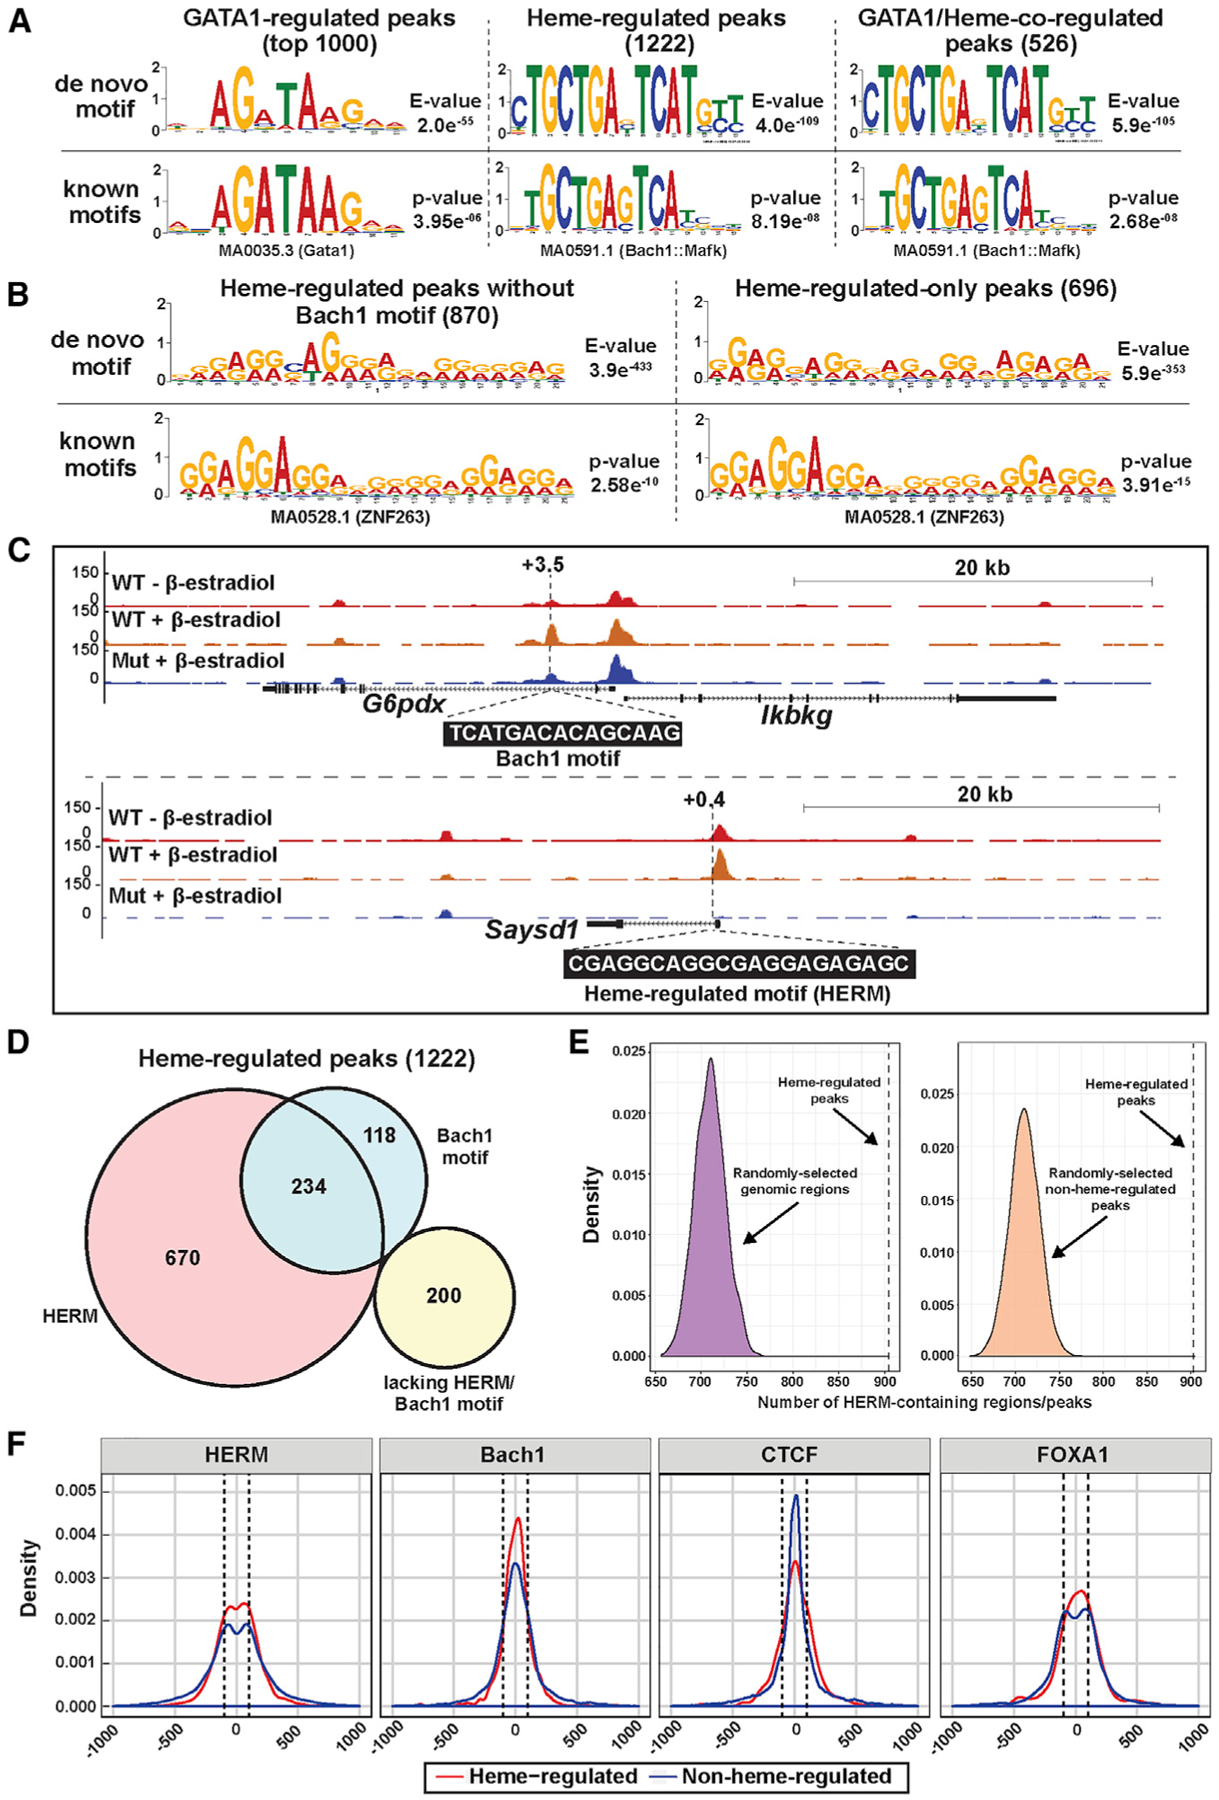
(A) De novo motifs identified by MEME analysis of the top 1,000 GATA1-regulated peaks, 1,222 heme-regulated peaks, or 526 GATA1/heme-co-regulated peaks. A known motif matching each de novo motif is shown below.
(B) De novo motifs were identified by MEME using 870 heme-regulated peaks without Bach1 motif or 696 heme-regulated-only peaks. One known motif matching each de novo motif is shown below. “Heme-regulated-only” peaks were not GATA1 regulated. (C) ATAC-seq tracks for representative heme-regulated peaks with Bach1 motif or HERM. The numbers indicate the location of Bach1 motif or heme-regulated motif (HERM) relative to the transcription start sites (in kb).
(D) Venn diagram depicting the number of heme-regulated peaks that contain Bach1 motifs and/or HERMs.
(E) Density distribution plots depicting the number of HERM-containing genomic regions from 10,000 repeats of random sampling of the mouse genome (left) or non-heme-regulated ATAC-seq peaks (right) with number and length matching that of heme-regulated ATAC-seq peaks. The dotted lines indicate the number of heme-regulated ATAC-seq peaks that contain HERMs.
(F) Density distribution plot depicting the distance of HERM, Bach1 motif, CTCF, and FoxA1 motifs from the ATAC-seq peak center. Dotted lines, 100 bp from the peak center.
See also Figure S1.