
Figure 4. Integrating ATAC-Seq and RNASeq Datasets Reveals Mechanisms Underlying GATA1/Heme-Mediated Establishment of Genetic Networks.
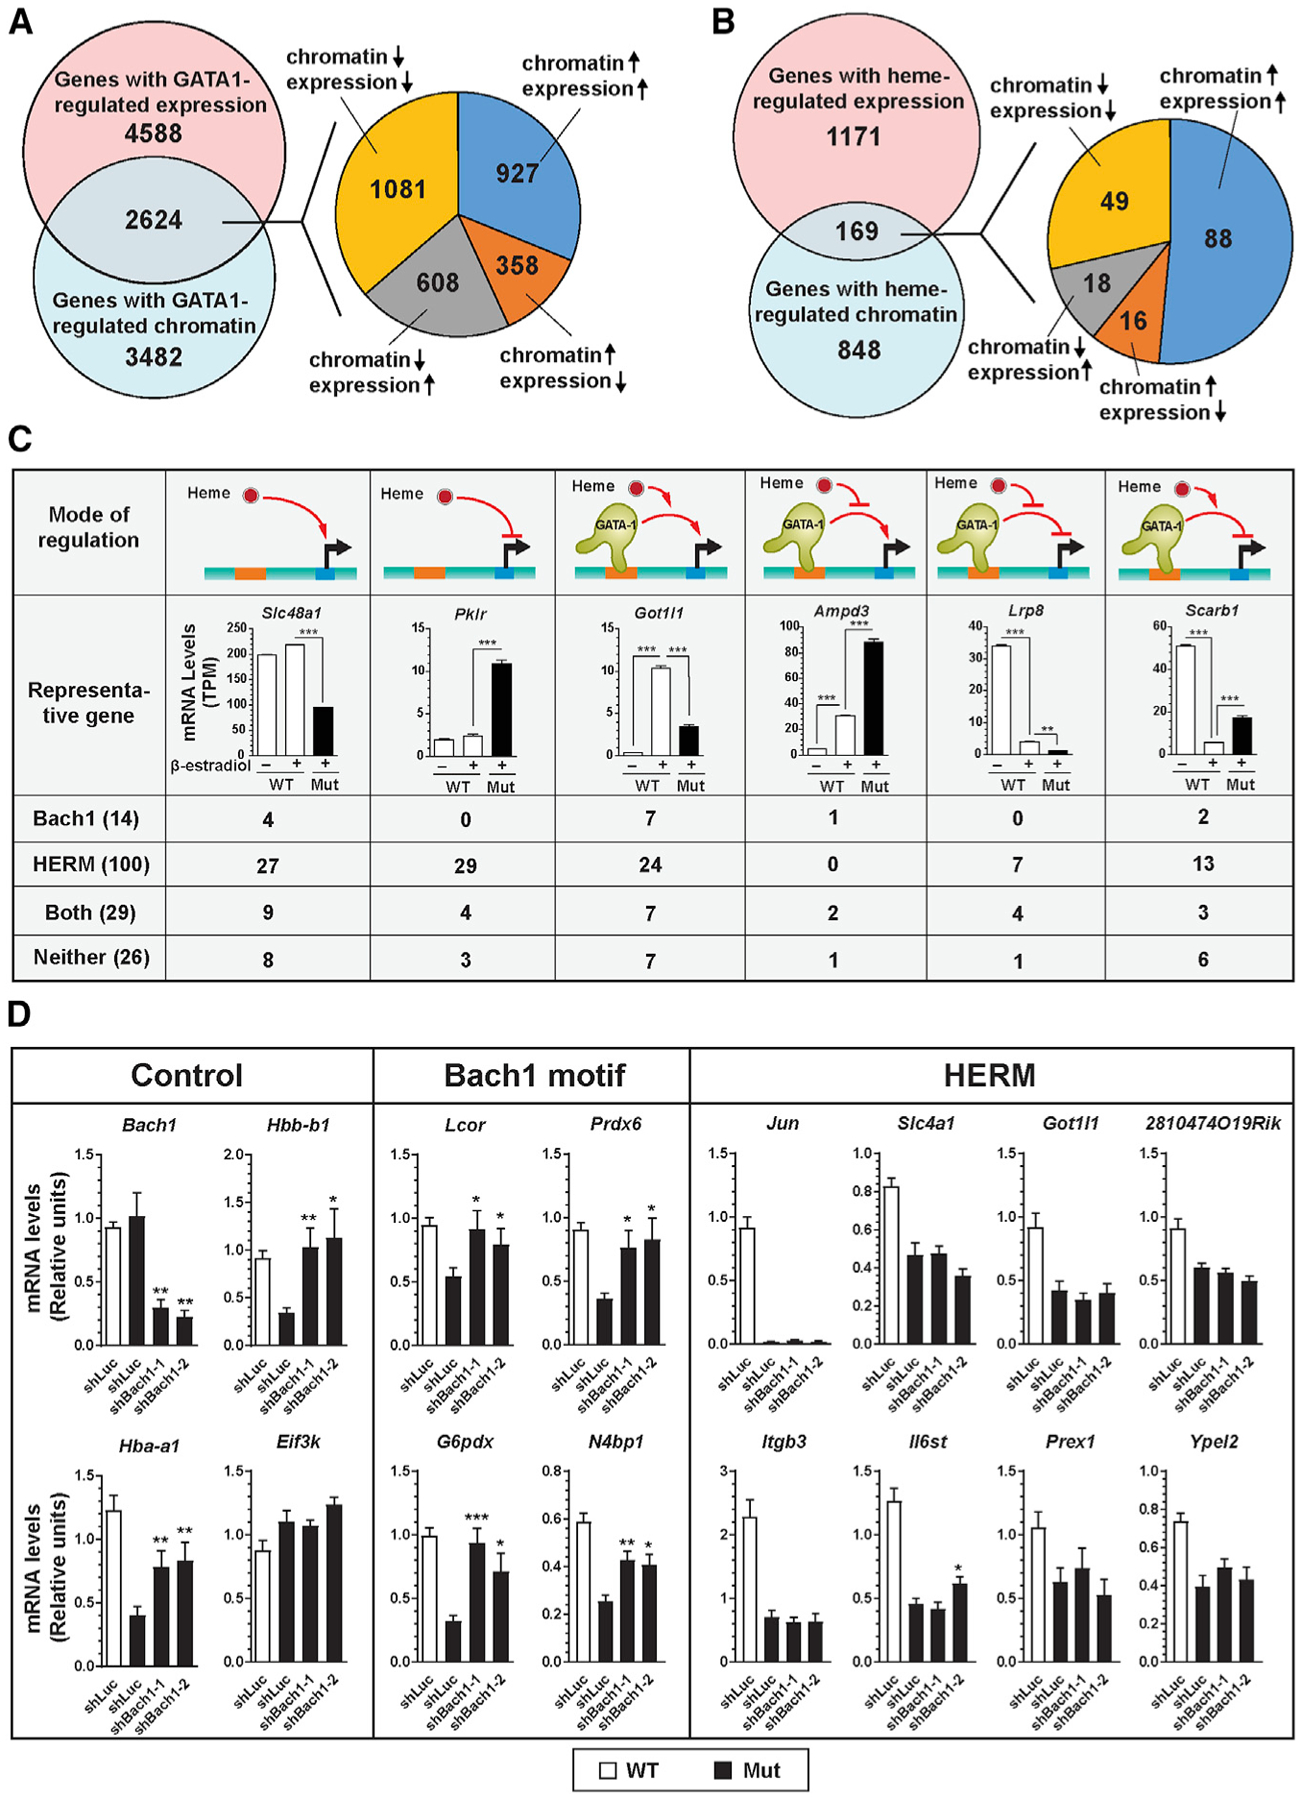
(A) Venn diagram illustrating overlap between genes with GATA1-regulated RNA expression and GATA1-regulated chromatin. The pie chart depicts the number of genes with distinct modes of regulation.
(B) Venn diagram depicting overlap between genes with heme-regulated RNA expression and heme-regulated chromatin. The pie chart illustrates the number of genes with distinct regulatory modes.
(C) GATA1/heme gene regulatory modes. Expression of representative genes (n = 3, mean ± SE; p values were calculated by two-tailed unpaired Student’s t test; ***p < 0.001), and the number of genes containing HERM and/or Bach1 motifs in each cohort.
(D) shRNA knockdown of Bach1 in b-estradiol-induced mutant G1E-ER-GATA1 cells. mRNA was quantified by qRT-PCR (n = 6, mean ± SE). p values were calculated relative to shLuc-infected mutant cells by a two-tailed paired Student’s t test (*p < 0.05, **p < 0.01, and ***p < 0.001).
See also Figures S2, S3, and S5.