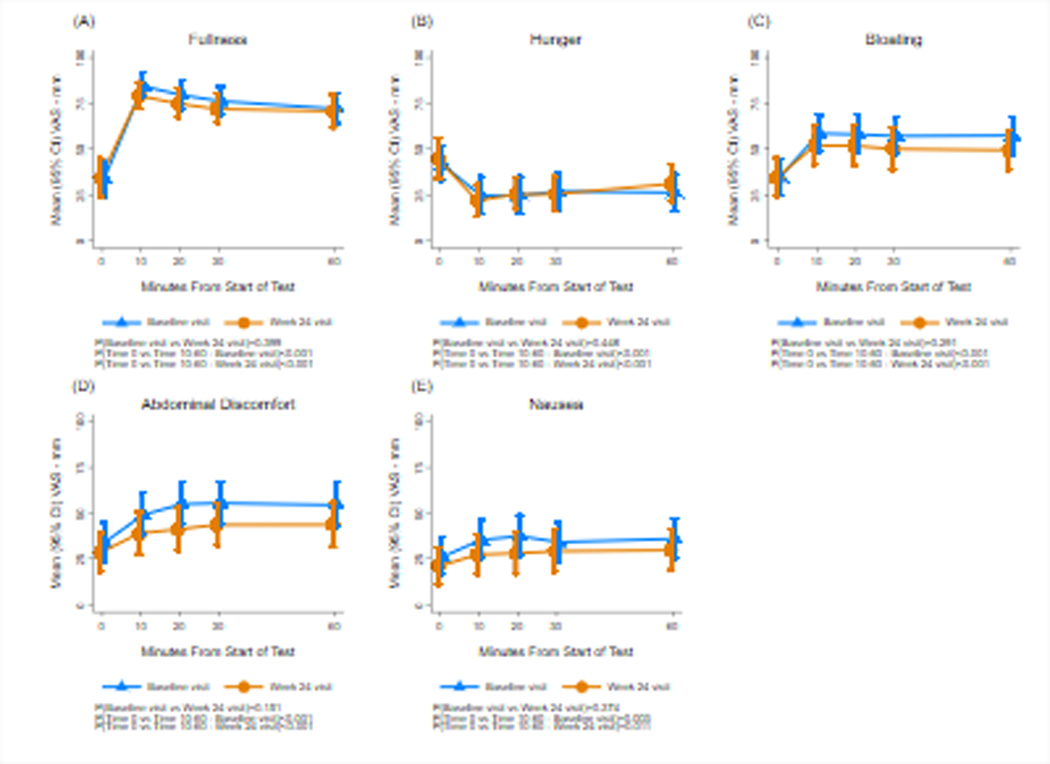
Figure 4.

Fullness, hunger, bloating, abdominal discomfort, and nausea scores are shown before and after the caloric meal satiety test (CMST) at baseline and 24 weeks. The X axis shows time in minutes. Time 0 indicates the 10 minutes before the test meal and 10, 20, 30, and 60 minutes indicates time after ingestion. The Y axis shows the symptom intensity on the visual analog scale (VAS) in millimeters (mm). Fullness increased significantly after the CMST and hunger decreased significantly, and symptoms of bloating, abdominal discomfort, and nausea all increased significantly at baseline and the Week 24 visits. Compared with baseline visits, there were no significant changes in symptoms at Week 24.
