
Figure 7B.
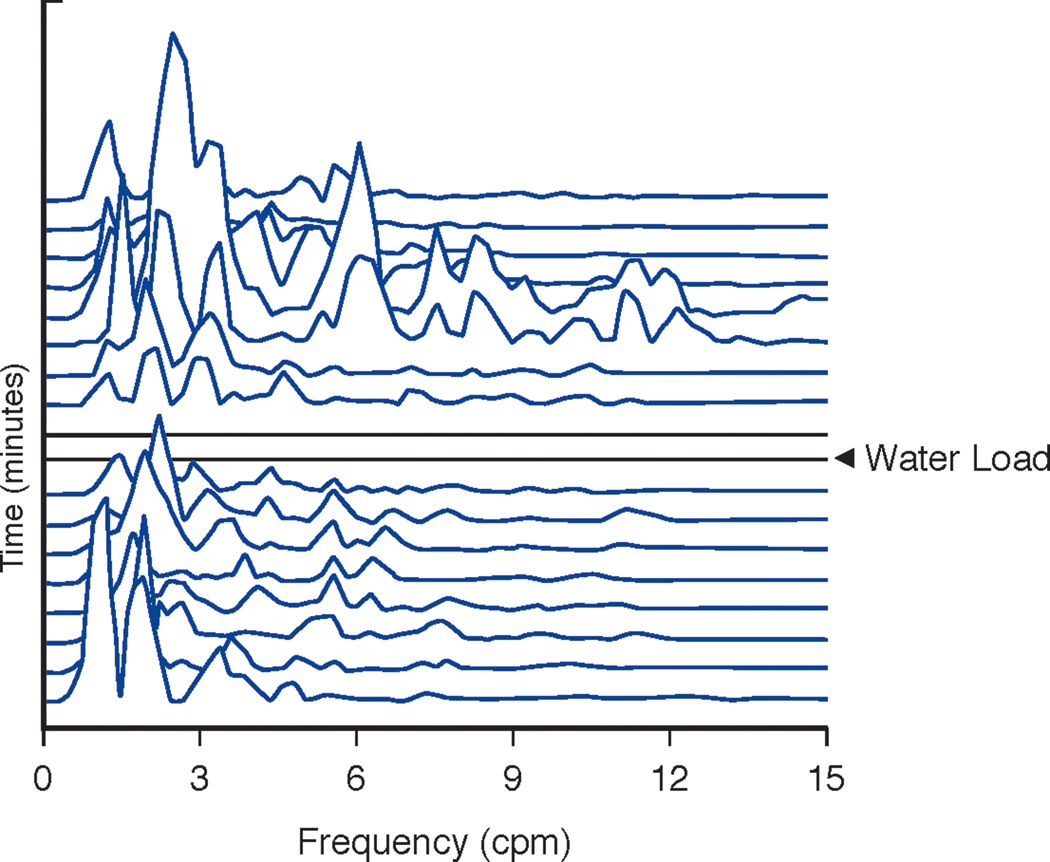
Running spectral analysis of the GMA shown in 7A before and after the WLST. In contrast to Figure 6B, note the multiple peaks in the gastric dysrhythmia frequencies (tachygastria 3.5–10 cpm; bradygastria 1–2.5 cpm) and the lack of 3 cpm peaks before and after the WLST. The X axis shows frequency from 1–15 cpm. The Y axis shows time with each line representing 4 minutes of GMA with 75% overlap. The Z axis shows peaks that reflect frequencies according to amplitude or power of the GMA in the EGG signal. The two flat lines indicate the time of ingestion of the water load.