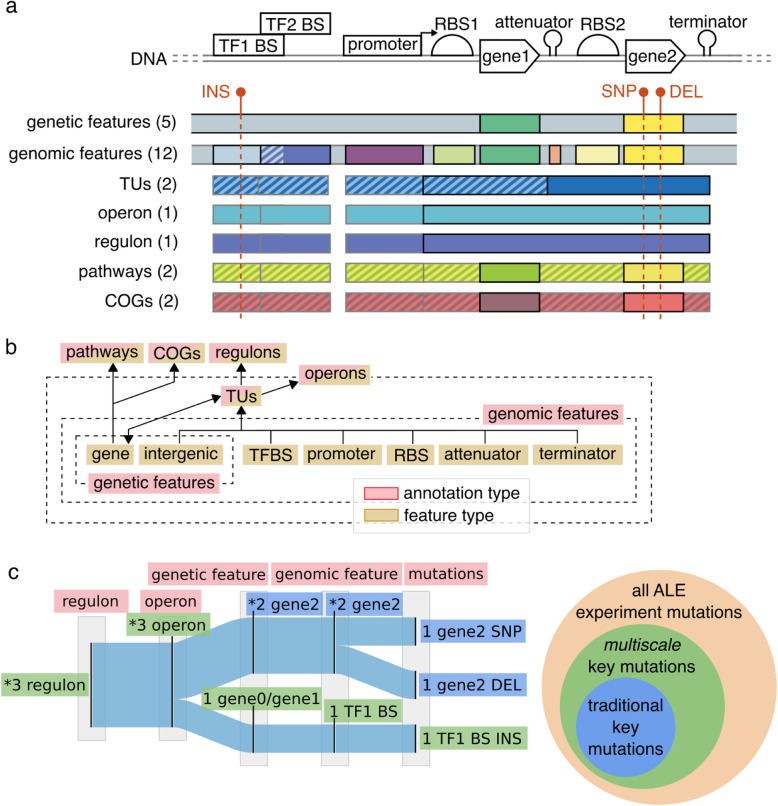
Fig. 1.
An illustration of how features were connected together in this work’s multiscale annotation framework. a An illustration of the variety of annotations, given in parenthesis per annotation type, for the E. coli K-12 MG1655 genome and how a single mutation can affect multiple features across different scales of annotations. The diagonal striped regions illustrate overlapping features. Dark-edged rectangles represent defining features for an annotation type. Grey-edged boxes represent operational regions or features associated with the defining features. Features are not to scale. (b) A flow diagram demonstrating the mapping of mutated small-scale features onto larger-scale features of the multiscale annotation framework of E. coli K-12 MG1655 from this work. c An example of the Sankey diagram visualization used in this work to demonstrate the number of mutations to each feature and the connectivity of smaller-scale features to their larger-scale counterparts. Each feature is annotated with a value representing the number of instances the feature was observed to be mutated. Significantly enriched features are annotated with an asterisk (*). Mutated features contributing to the significant enrichment of higher-level annotations are considered as hosting key mutations. The venn diagram illustrates the potential for finding more key mutations than traditional methods through multiscale scale annotation mutation convergence

