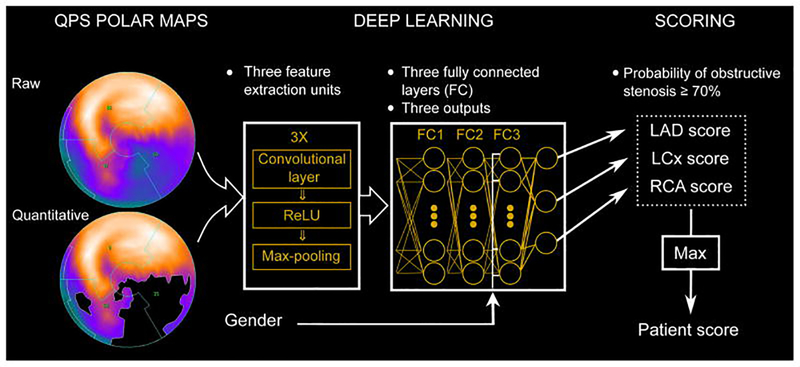
Figure 2. Deep learning prediction of obstructive CAD from myocardial perfusion imaging.
SPECT polar map images are directly connected to the CNN, and patterns of perfusion defects are identified via feature extraction (left). These image features then pass through 3 fully connected layers (FC) in a deep learning process (centre) which predicts the probability of obstructive CAD in each vascular territory (right). CAD: coronary artery disease; CNN: convolutional neural network; LAD: left anterior descending; LCx: left circumflex; RCA: right coronary artery; ReLU: rectified linear unit (linear function mapping input to output values); QPS: quantitative perfusion SPECT. Reproduced with permission from Betancur et al. (100).

