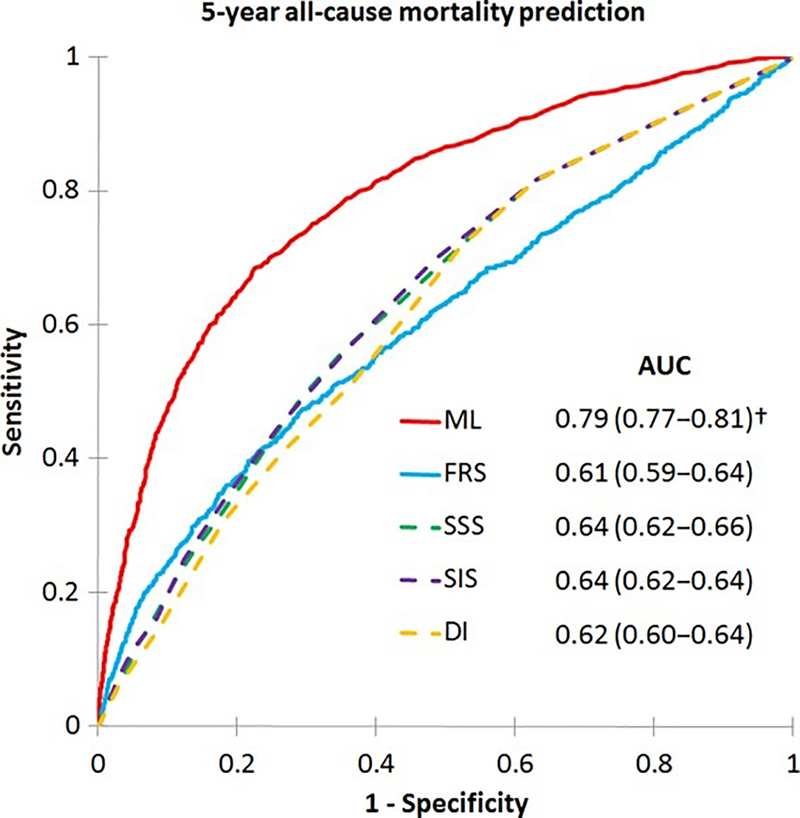
Figure 3. ML prediction of all-cause mortality.
Receiver-operating characteristics curves for prediction of 5-year all-cause mortality: a ML risk score integrating clinical and coronary CTA data had a higher AUC than the Framingham Risk Score (FRS) and CTA severity scores (Segment Stenosis Score [SSS], Segment Involvement Score [SIS], Duke Index [DI]) (p<0.001†). AUC: area under the curve; CTA: computed tomography angiography; ML: machine learning. Reproduced with permission from Motwani et al. (96).

