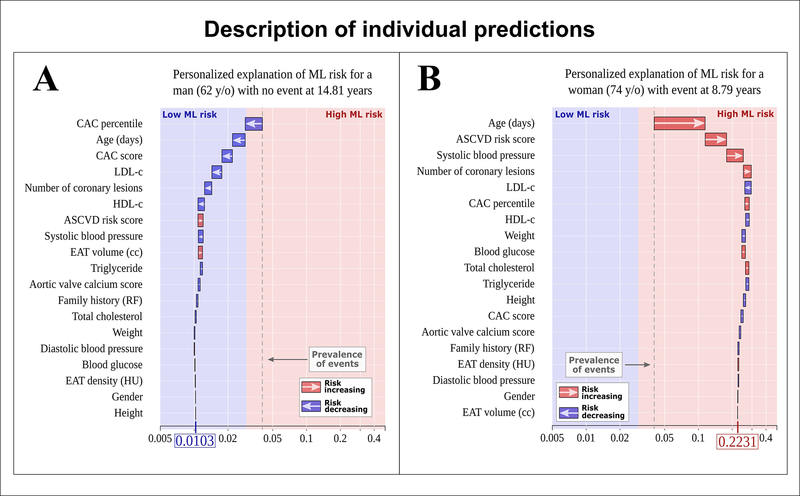
Figure 5. Explainable AI through individualized ML risk prediction.
ML model for the prediction of myocardial infarction (MI) and cardiac death with subject-specific feature importance for a 62-year-old man with no event (A) and a 74-year-old woman with MI (B). The X-axis corresponds to the ML risk score. The arrows represent the influence of each covariate on the overall prediction; either decreasing (blue) or increasing (red) the risk of future events. The combination of all covariates’ influence provides the final ML risk score. Subject (A) has a low ML risk score (0.0105), while subject (B) has a high ML risk score (0.2206). The blue and red colors provide the separation between low and high ML risk as determined by Youden’s index. The gray dashed lines represent the overall prevalence of events in the population (~4%). Reproduced with permission from Commandeur et al. (97).

