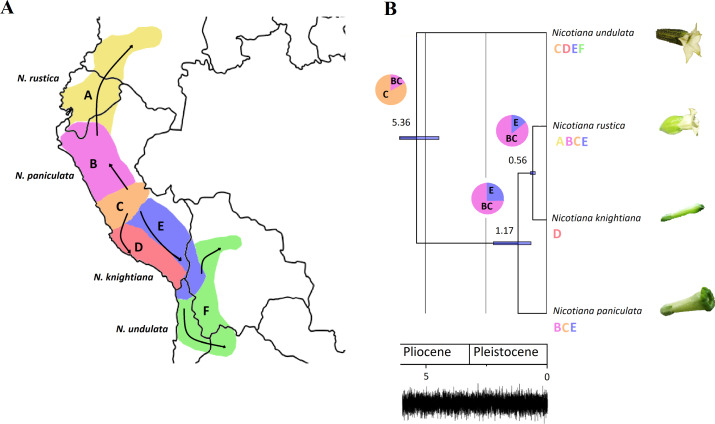
Figure 3. Plastome phylogeny and biogeography of the tetraploid Nicotiana rustica and related species.
(A) Map showing the six biogeographic areas used to infer the biogeographic history of the Nicotiana rustica in South America. Arrows illustrate the dispersal events inferred from the biogeographic analysis. Geographical distribution for each terminal is indicated using the biogeographic regions subdivision. The most probable ancestral area is figured at each node of the phylogenetic tree. Pie-charts represent relative probabilities of ancestral states at each node. (B) Node-calibrated Bayesian maximum clade credibility tree with 95% highest posterior density (HPD) interval for node ages presented as horizontal bars and mean values are displayed above each node. All nodes have PP ≥ 0.97 and BS ≥ 87%. Trace plot of the combined chains showing the sampled joint probability and the convergence of the chains.

